

Report Overview
The Core Network KPI Dashboard market is gaining strong attention from telecom operators and enterprise network teams that want better control, visibility, and real-time performance tracking of their core infrastructure. From a client perspective, this market reflects a clear shift toward data-driven network operations.
Where decision-making relies on accurate KPI monitoring across 4G, 5G, and evolving cloud-native core environments. In 2025, the market stands at USD 2.25 billion and is projected to reach USD 14.40 billion by 2035, expanding at a CAGR of 20.40%, indicating rapid adoption driven by increasing network complexity and demand for service quality assurance.
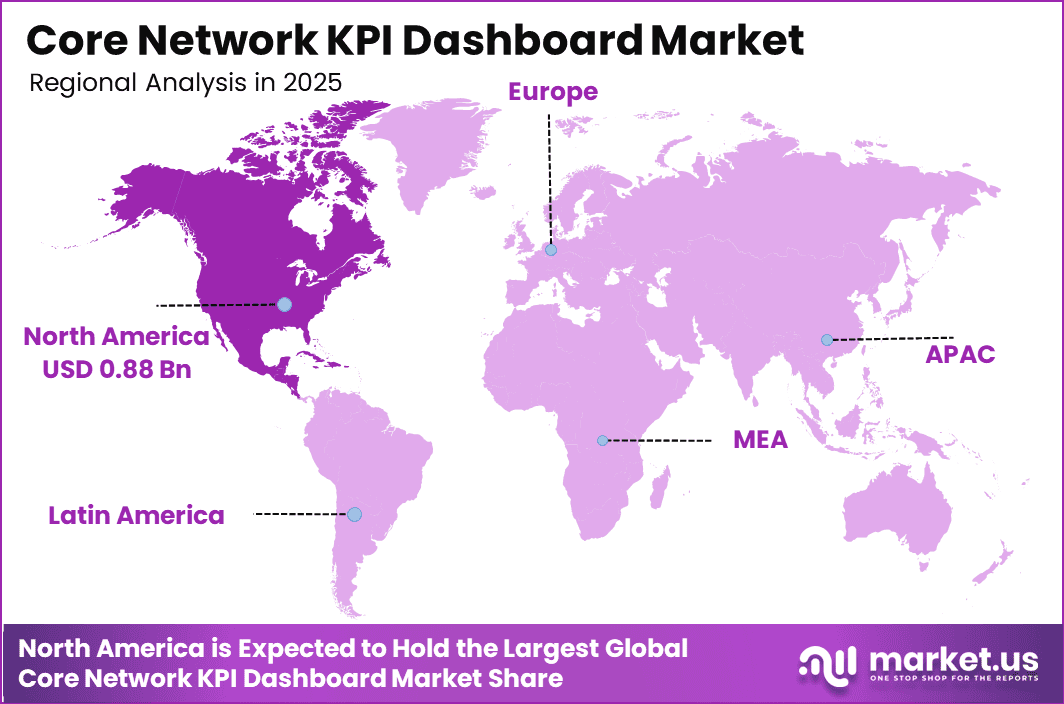
North America holds a dominant position with a 39.4% share, contributing around USD 0.88 billion in 2025. This leadership is supported by early 5G deployment, strong telecom infrastructure, and higher investments in network automation.
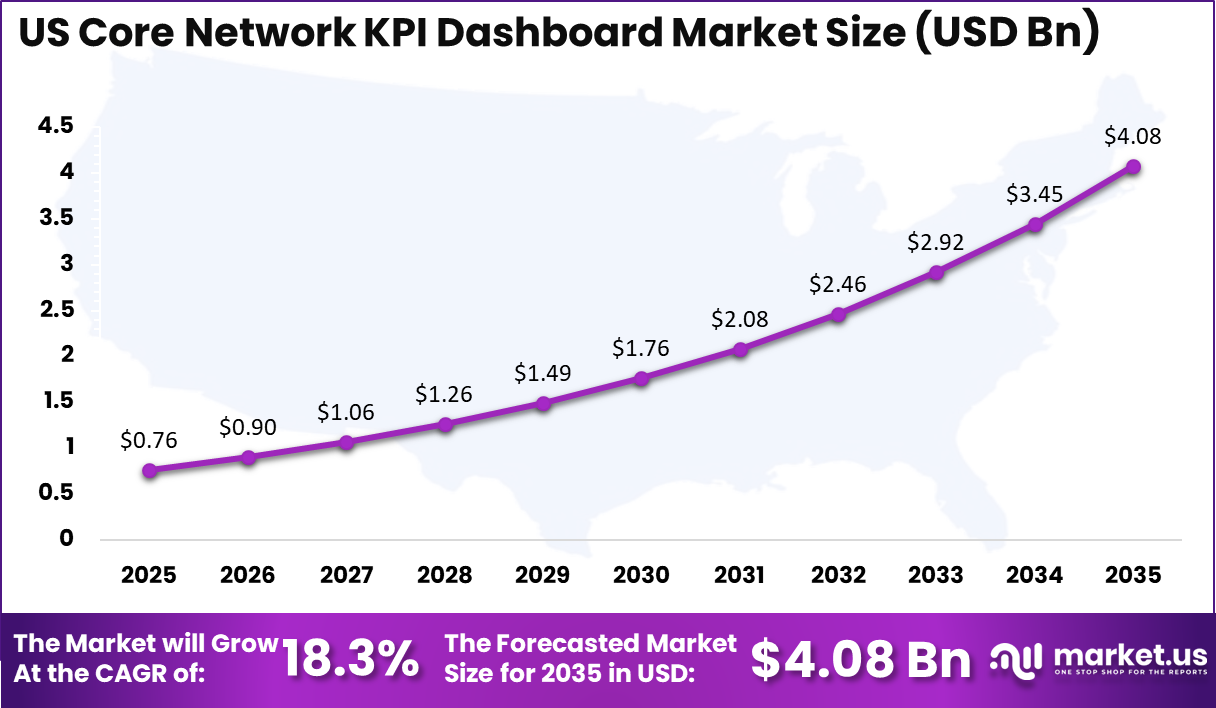
Within the region, the US represents a major revenue contributor, reaching USD 0.76 Billion in 2025 and projected to grow to USD 4.08 billion by 2035 at a CAGR of 18.3%. For clients evaluating this market, these figures highlight a high-growth environment with strong opportunities in analytics platforms, AI-driven monitoring tools, and performance optimization solutions tailored for next-generation telecom networks.
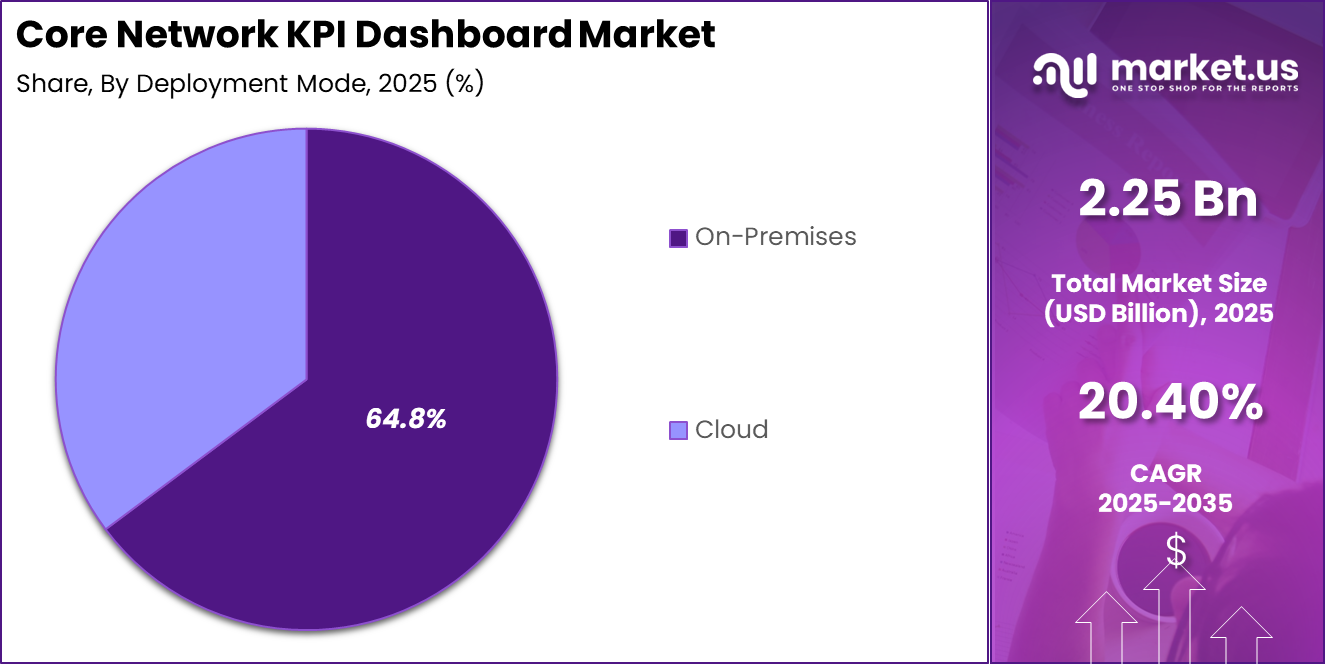
The Core Network KPI Dashboard market shows a clear concentration of demand across specific segments, reflecting current telecom infrastructure priorities. By component, hardware accounts for 45.7%, indicating strong reliance on physical systems such as servers, probes, and network appliances that enable real-time data collection and performance tracking. These systems remain essential as telecom networks handle millions of signaling events per second and require high processing capacity to maintain accuracy in KPI reporting. By deployment mode, on-premises leads with 64.8%, highlighting the importance of data security, latency control, and direct infrastructure integration. Telecom operators continue to prefer on-site deployments as core networks process sensitive subscriber and operational data, often exceeding several terabytes daily in large-scale environments. This approach also supports faster troubleshooting and ensures compliance with strict regulatory requirements in many regions. By application, network optimization holds 44.6%, driven by the need to manage increasing data traffic and improve service quality. With average mobile data consumption per user surpassing 20 GB per month in several markets, operators depend on KPI dashboards to identify bottlenecks and optimize network resources efficiently. By end-user, telecommunications dominates with 52.7%, as operators require continuous monitoring across complex, multi-layered core networks to maintain uptime, enhance user experience, and support evolving digital services. Hardware accounts for 45.7% of the Core Network KPI Dashboard market, reflecting its critical role in supporting high-performance data collection and processing across telecom networks. Core network environments generate massive volumes of real-time data, often exceeding several terabytes per day for large operators, which requires robust physical infrastructure such as servers, probes, and data acquisition systems. These hardware components enable continuous monitoring of signaling traffic, session performance, and network utilization, ensuring accurate KPI measurement across complex architectures. Software plays an equally important role by transforming raw network data into actionable insights. Modern KPI dashboard software platforms integrate advanced analytics, visualization tools, and AI-based algorithms to process millions of events per second. Many operators are increasingly adopting cloud-native and containerized software solutions that allow flexible scaling and seamless integration with virtualized core networks. This shift supports faster decision-making and enhances network visibility across distributed environments. Services support both hardware and software components by ensuring smooth deployment, integration, and ongoing optimization. Telecom operators rely on managed and professional services to handle system configuration, upgrades, and performance tuning. With growing network complexity, service providers also assist in implementing automation strategies, helping reduce manual intervention and improving overall operational efficiency in KPI monitoring systems. On-premises deployment holds 64.8% of the Core Network KPI Dashboard market, reflecting strong preference among telecom operators for direct control over critical network data and infrastructure. Core networks process highly sensitive subscriber information and operational metrics, often generating multiple terabytes of data daily, which makes local deployment essential for ensuring data security and regulatory compliance. On-premises systems also enable faster data processing with minimal latency, allowing operators to monitor millions of signaling events per second and respond quickly to network issues. This deployment model is particularly important in environments where uptime targets exceed 99.999%, requiring highly reliable and tightly integrated monitoring systems. Cloud deployment is gradually gaining traction as operators move toward virtualized and software-defined core networks. Cloud-based KPI dashboards offer scalability, enabling telecom providers to handle fluctuating data volumes without heavy upfront infrastructure investment. These solutions support centralized monitoring across geographically distributed networks and allow easier integration with AI-driven analytics tools. As more than half of new core network functions are expected to operate in cloud environments, demand for cloud-based KPI dashboards is anticipated to increase steadily. This shift is particularly relevant for operators seeking flexibility, faster deployment cycles, and cost-efficient expansion of monitoring capabilities in evolving telecom ecosystems. Network optimization accounts for 44.6% of the Core Network KPI Dashboard market, driven by the growing need to manage rising data traffic and improve overall network efficiency. Telecom networks now handle peak loads exceeding several terabits per second in dense urban environments, requiring continuous monitoring to identify congestion points and optimize resource allocation. KPI dashboards support operators in analyzing real-time performance metrics, helping reduce latency levels that are often targeted below 10 milliseconds for advanced services. Security and compliance have become critical applications as telecom networks process sensitive user and enterprise data. With cyberattacks on telecom infrastructure increasing year over year, operators are using KPI dashboards to track anomalies, detect unauthorized access, and ensure adherence to regulatory standards. These systems help monitor millions of events daily to maintain secure and compliant operations. Traffic management plays a key role in balancing network load across multiple nodes and regions. KPI dashboards enable operators to dynamically route traffic, improving efficiency during peak usage periods. Quality of service focuses on maintaining a consistent user experience, with dashboards tracking metrics such as call drop rates, packet loss, and latency. The other category includes applications like capacity planning and predictive maintenance, which support long-term network performance and scalability. Telecommunications accounts for 52.7% of the Core Network KPI Dashboard market, reflecting its central role in managing large-scale, high-complexity network environments. Telecom operators handle millions of concurrent user sessions and process vast volumes of signaling data every second, requiring continuous monitoring to maintain service reliability. KPI dashboards enable operators to track critical metrics such as latency, throughput, and network availability, supporting uptime targets that often exceed 99.999%. With the expansion of 5G standalone networks and increasing demand for real-time services, telecom providers rely heavily on these dashboards to ensure consistent performance and rapid fault resolution. Enterprises are emerging as a growing segment, particularly with the adoption of private 5G networks and digital transformation initiatives. Large organizations require KPI dashboards to monitor internal network performance, support mission-critical applications, and ensure seamless connectivity across distributed operations. Cloud service providers also represent a key user group, as they manage large data centers and virtualized network functions. These providers depend on KPI dashboards to maintain service-level agreements, optimize resource utilization, and handle fluctuating workloads efficiently. The other category includes sectors such as government and research institutions, where network monitoring supports secure communication and specialized operational requirements. North America holds 39.4% of the Core Network KPI Dashboard market, reaching USD 0.88 Billion in 2025, supported by strong telecom infrastructure and early adoption of advanced network technologies. The region has a high concentration of 5G deployments, with hundreds of operational networks and a growing shift toward standalone core architectures. This evolution has increased the need for real-time KPI monitoring solutions capable of handling millions of network events per second and ensuring ultra-low latency performance across services. The United States plays a central role in regional growth, driven by continuous investments in network modernization and automation. Telecom operators in the region are actively integrating AI-based analytics into their operations, with a large share already using intelligent monitoring systems to improve fault detection and reduce downtime. High mobile data consumption, often exceeding 25 GB per user per month, further drives the demand for advanced KPI dashboards that can optimize network performance and manage congestion effectively. In addition, North America benefits from strong cloud infrastructure and the presence of large-scale data centers, enabling seamless integration of KPI dashboards with virtualized and cloud-native core networks. This combination of technological maturity and investment focus positions the region as a key hub for innovation and sustained growth in network performance monitoring solutions. The United States Core Network KPI Dashboard market is valued at USD 0.76 Billion in 2025 and is projected to reach USD 4.08 billion by 2035, expanding at a CAGR of 18.3%. This growth reflects the country’s strong focus on telecom infrastructure modernization and increasing reliance on advanced network analytics. The US has one of the most mature telecom ecosystems, with widespread 5G deployment and a growing transition toward standalone core networks, which require continuous and precise KPI monitoring. From a client perspective, the US market presents significant opportunities driven by high mobile data consumption and dense network traffic. Average monthly data usage per smartphone user has already crossed 25 GB, while large operators manage millions of simultaneous connections, creating a need for real-time performance tracking tools. KPI dashboards help telecom providers maintain high service standards, reduce network downtime, and improve customer experience in highly competitive environments. Additionally, the adoption of AI and automation in network operations is accelerating across the US. A large share of operators are investing in predictive analytics to reduce fault resolution time and enhance operational efficiency. The presence of advanced cloud infrastructure and data centers further supports the deployment of scalable KPI dashboard solutions, positioning the US as a key growth hub in this market. The Core Network KPI Dashboard market is driven by the rapid increase in mobile data consumption and the expansion of 5G standalone networks. Global smartphone users have crossed 6.8 billion, and average monthly data usage in advanced markets exceeds 20 to 30 GB per user, creating a strong need for real-time network visibility. Telecom operators process millions of signaling events per second, making manual monitoring inefficient and increasing reliance on automated KPI dashboards. The push for ultra-reliable networks with uptime targets above 99.999% further strengthens demand, as even a few minutes of downtime can lead to significant revenue loss. Additionally, the rise of latency-sensitive applications such as autonomous systems, remote healthcare, and industrial automation requires continuous performance tracking. KPI dashboards enable operators to detect anomalies instantly and maintain consistent service quality, supporting network stability in highly dynamic environments. High implementation complexity and integration challenges act as key restraints in this market. Telecom networks consist of legacy systems, multi-vendor environments, and evolving architectures, making it difficult to deploy unified KPI dashboards. Large operators often manage thousands of network nodes and distributed data centers, which complicates data aggregation and standardization. Initial deployment costs can also be substantial, as infrastructure upgrades and skilled workforce requirements add to operational expenses. Data privacy and regulatory compliance present additional barriers, especially when handling sensitive subscriber information across multiple regions. Moreover, false alerts and data overload from millions of real-time metrics can reduce efficiency if dashboards are not properly optimized. These challenges may slow adoption among smaller operators or those with limited technical capabilities. The growing adoption of cloud-native networks and virtualization presents strong growth opportunities for KPI dashboard solutions. More than half of new telecom core functions are now deployed using containerized and software-defined architectures, creating demand for flexible and scalable monitoring tools. The expansion of private 5G networks across industries such as manufacturing, logistics, and energy is opening new revenue streams for KPI dashboard providers. These networks require customized performance monitoring to support critical operations and ensure reliability. In addition, the rise of IoT ecosystems, expected to exceed 30 billion connected devices globally, is generating continuous streams of performance data. This creates opportunities for advanced analytics platforms that can process and interpret large datasets in real time. Integration with AI and machine learning also offers potential to enhance predictive maintenance and optimize network operations efficiently. A key trend shaping the market is the increasing use of AI-driven and autonomous network management systems. Around 70% of telecom operators are adopting AI-based tools to improve fault detection and reduce resolution time by up to 40%. These intelligent KPI dashboards can analyze patterns, predict failures, and automate corrective actions without manual intervention. Another major trend is the shift toward edge computing, where nearly 40% of data processing is expected to occur closer to end users. This requires decentralized KPI monitoring while maintaining centralized visibility. Real-time analytics and visualization capabilities are also becoming more advanced, enabling operators to monitor network performance at granular levels. Additionally, there is a growing demand for unified dashboards that integrate multiple network layers, including core, edge, and cloud, into a single platform. These trends highlight the movement toward more intelligent, scalable, and responsive network monitoring solutions. The competitive landscape of the Core Network KPI Dashboard market is shaped by large telecom technology providers and specialized network analytics firms, each leveraging scale, innovation, and integration capabilities. Companies such as Huawei Technologies Co., Ltd. lead the broader telecom infrastructure space with revenues exceeding USD 118 billion, reflecting their strong global footprint in network equipment and monitoring solutions. Cisco Systems, Inc. operates with over 86,000 employees and focuses on integrating networking with security and analytics, strengthening its position in KPI dashboard solutions through AI-driven insights and automation. Nokia Corporation and Ericsson AB reported annual revenues of around USD 26 billion and USD 22 billion, respectively, highlighting their strong presence in network infrastructure and performance monitoring platforms. Mid-tier and software-focused players such as Amdocs Limited, Netcracker Technology Corporation, and Mavenir Systems, Inc. are gaining traction by offering cloud-native KPI analytics and service assurance platforms. These companies focus on flexible deployment and faster integration with 5G core environments. Meanwhile, firms like Ciena Corporation and Fujitsu Limited are investing in automation and real-time analytics to enhance network visibility. Overall, competition remains moderately concentrated, with large vendors controlling significant infrastructure deployments while smaller players compete through innovation, API-driven platforms, and specialized analytics capabilities.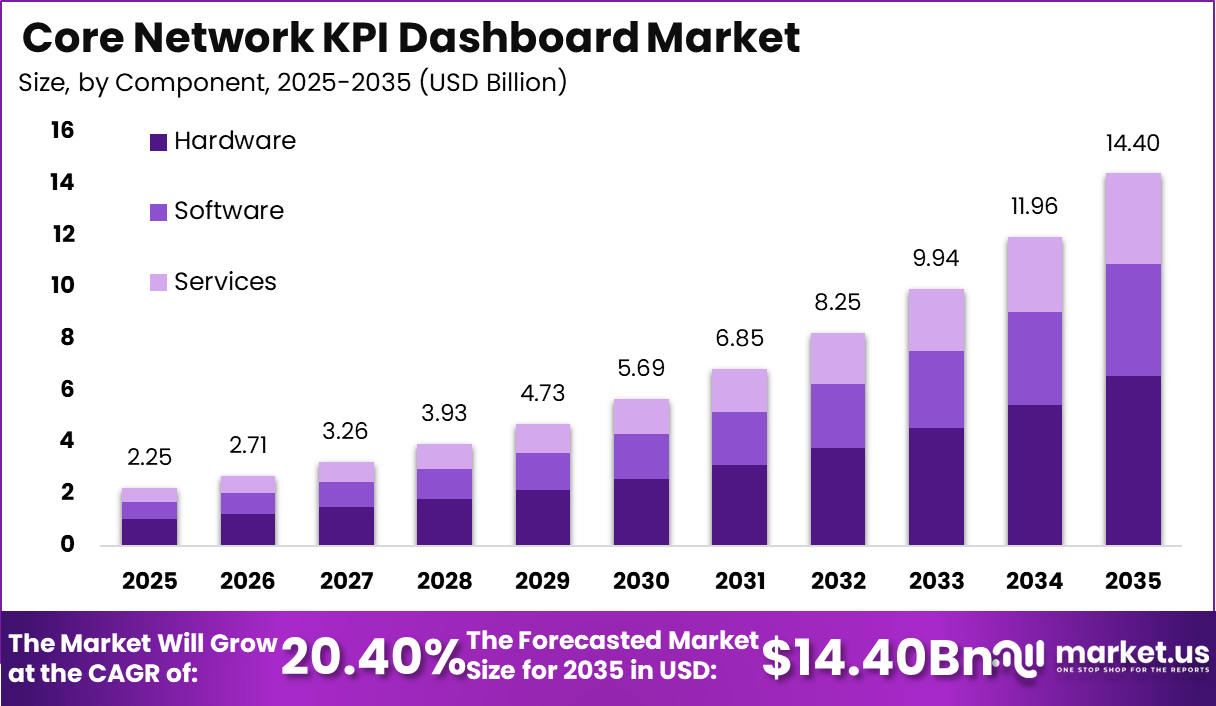
Key Market Segments
Research-Based Segments
By Component
By Deployment Mode
By Application
By End-User
By Component
By Deployment Mode
By Application
By End-User
Regional Analysis
US Market Size
Regional Analysis and Coverage
Driving Factors
Restraint Factors
Growth Opportunities
Trending Factors
Competitive Analysis
Top Key Players in the Market
Recent Developments