

Footfall Heatmap Analytics Market
Footfall Heatmap Analytics Market By Component (Software, Hardware, Services), By Application (Retail, Transportation, Hospitality, Healthcare, Banking, Others), By Deployment Mode (On-Premises, Cloud), By Organization Size (Small and Medium Enterprises, Large Enterprises), By End-User (Shopping Malls, Airports, Stadiums, Hospitals, Banks, Others), By Regional Analysis, Global Trends and Opportunity, Future Outlook By 2026-2035
- Published date: Apr. 2026
- Report ID: 183154
- Number of Pages: 306
- Format:
- Overview
- Table of Contents
- Major Market Players
Quick Navigation
- Report Overview
- Top Market Takeaways
- Drivers Impact Analysis
- Restraints Impact Analysis
- By Component Analysis
- By Application Analysis
- By Deployment Mode Analysis
- By Organization Size Analysis
- By End User Analysis
- Investor Type Impact Analysis
- Technology Enablement Analysis
- Key Challenges
- Emerging Trends
- Growth Factors
- Key Market Segments
- Regional Analysis
- Competitive Analysis
- Future Outlook
- Recent Developments
- Report Scope
Report Overview
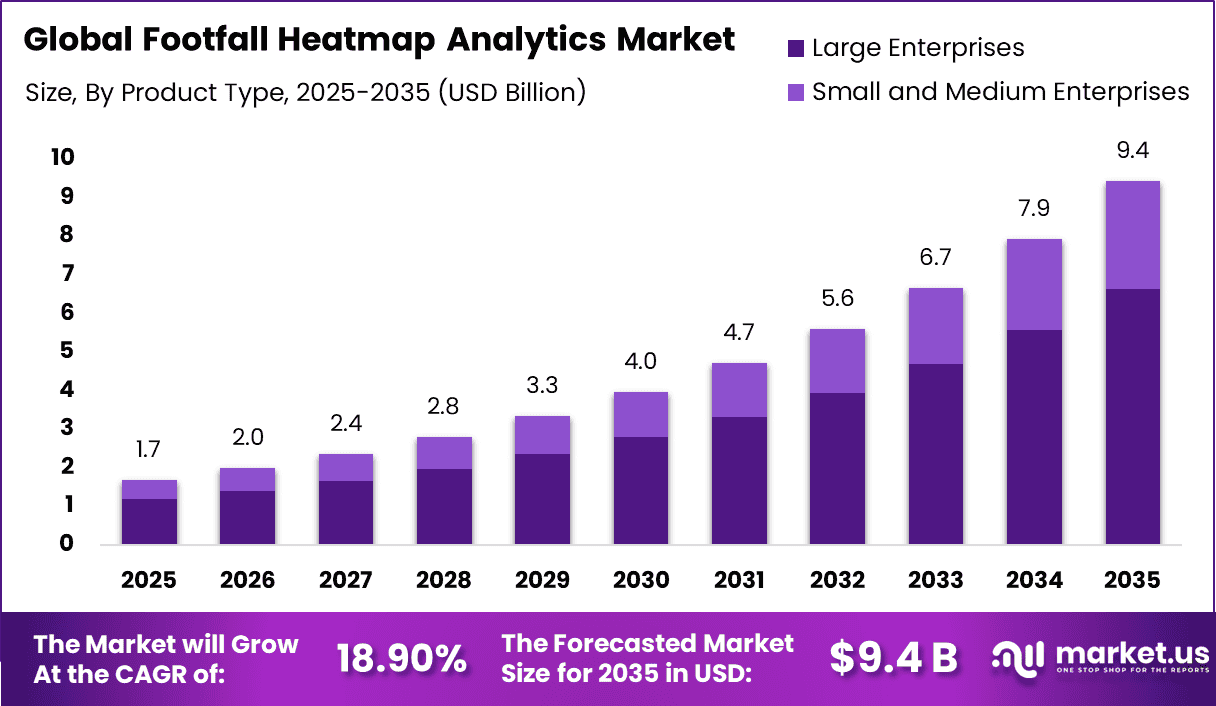
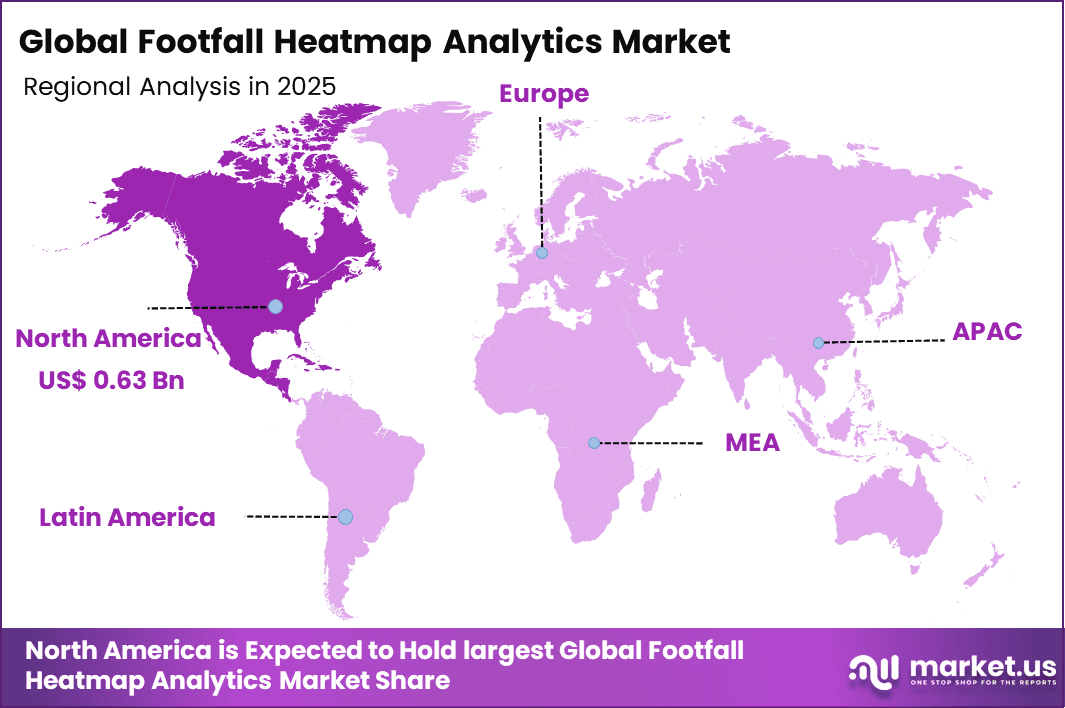
The Global Footfall Heatmap Analytics Market generated USD 1.7 billion in 2025 and is predicted to register growth from USD 2 billion in 2026 to about USD 9.4 billion by 2035, recording a CAGR of 18.90% throughout the forecast span. In 2025, North America held a dominant market position, capturing more than a 38.3% share, holding USD 0.63 Billion revenue.
Top Market Takeaways
- Hardware commands 56.7% market share, delivering overhead cameras, LiDAR sensors, and edge processors for privacy-preserving people counting and dwell time tracking.
- Retail applications capture 37.6%, enabling store layout optimization, promotional zone effectiveness, and conversion funnel analysis through anonymized traffic patterns.
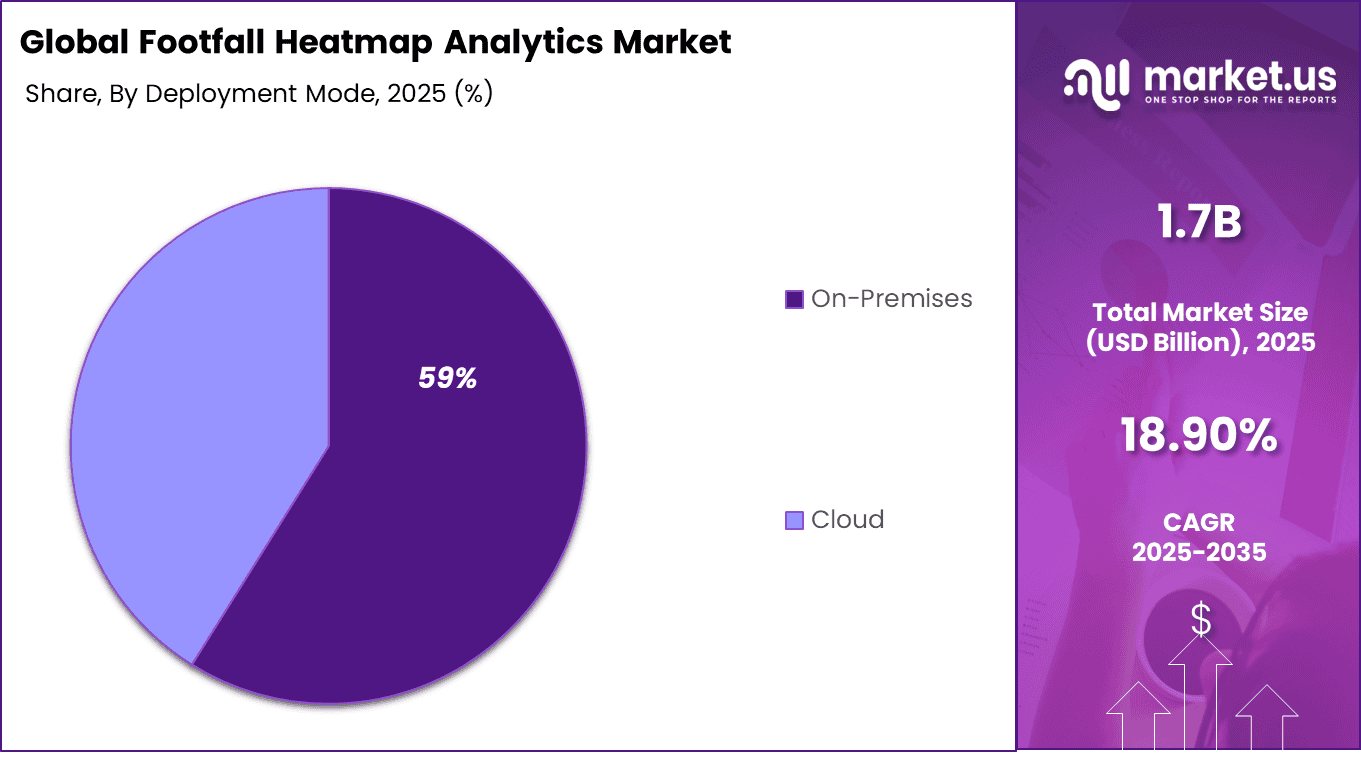
- On-premises deployment dominates at 58.9%, ensuring real-time processing, data sovereignty, and integration with POS/inventory systems without cloud latency.
- Large enterprises hold 70.4%, leveraging enterprise-grade platforms for multi-location benchmarking, staff scheduling, and peak-hour capacity planning.
- Shopping malls represent 34.5%, powering tenant performance measurement, common area utilization, and dynamic signage based on real-time crowd density.
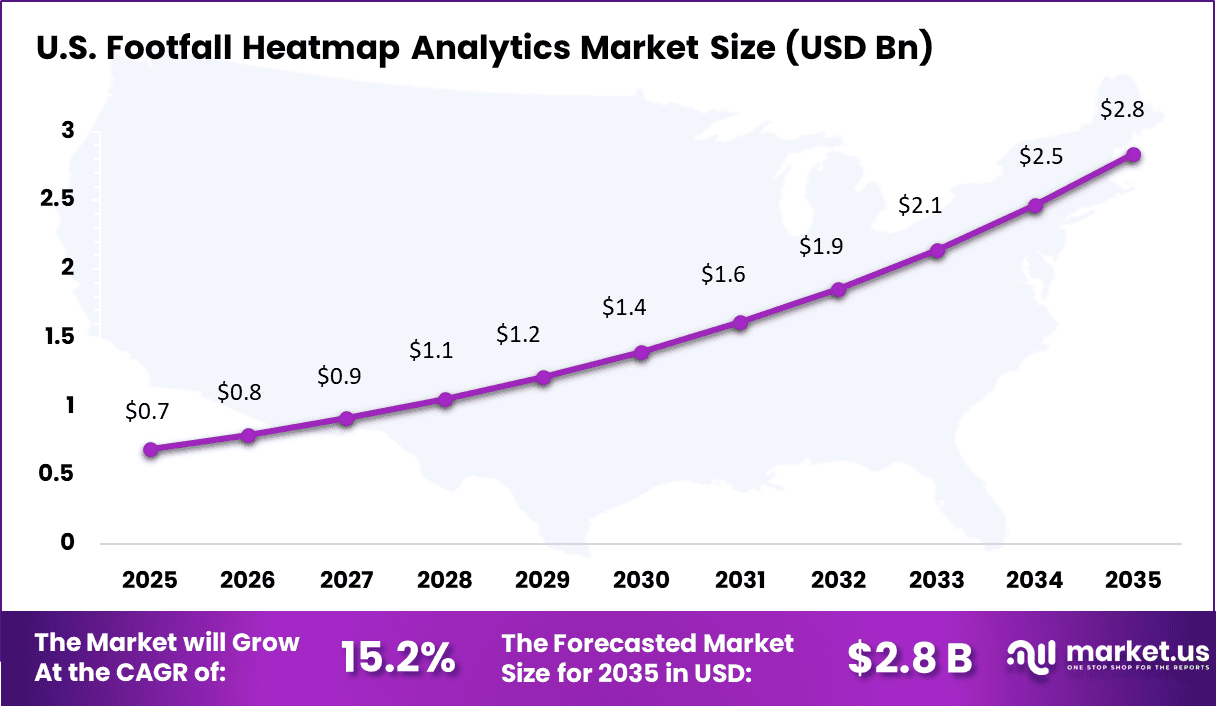
- North America drives 38.3% global value, with U.S. market at USD 0.69 billion and 15.2% CAGR, fueled by omnichannel retail strategies and post-pandemic traffic recovery.
+1.8% Global Short Term Improves business intelligence and planning Growth of smart cities and intelligent infrastructure +1.6% APAC, Europe Mid to Long Term Expands deployment across public spaces Integration with AI and video analytics +1.7% Global Mid Term Enables advanced behavioral insights Expansion of e-commerce analytics into physical retail +1.3% North America, APAC Mid Term Bridges online and offline consumer insights Restraints Impact Analysis
Restraint Factor Impact on CAGR Forecast (~%) Geographic Relevance Impact Timeline Strategic Limitation High initial deployment and infrastructure costs -1.5% Global Short Term Limits adoption among small retailers Data privacy and surveillance concerns -1.3% Europe, North America Mid to Long Term Increases regulatory pressure Lack of skilled professionals for analytics interpretation -1.1% Emerging Markets Mid Term Reduces effective utilization of solutions Integration issues with legacy retail systems -0.9% Global Mid Term Slows implementation timelines Accuracy limitations in crowded environments -0.8% APAC, Latin America Short to Mid Term Affects reliability of insights By Component Analysis
Hardware accounted for 56.7% of the Footfall Heatmap Analytics Market. This segment leads because sensors, cameras, and tracking devices are essential for capturing movement patterns and generating accurate heatmap data. These components enable real time tracking of customer behavior within physical spaces.
The segment is also supported by increasing adoption of in store analytics solutions. Businesses invest in reliable hardware to ensure precise data collection, which helps improve store layout decisions and customer engagement strategies.
By Application Analysis
Retail represented 37.6% of the market. This segment dominates because retailers use heatmap analytics to understand customer movement, identify high traffic zones, and optimize product placement. It helps improve sales performance and enhance the shopping experience.
The segment is driven by growing focus on data driven retail strategies. Businesses rely on footfall insights to refine store layouts, manage crowd flow, and increase conversion rates, which strengthens demand in this segment.
By Deployment Mode Analysis
On premises deployment held 58.9% of the market. This segment leads because organizations prefer to manage customer data within their own infrastructure to maintain privacy and security. It allows direct control over analytics systems and data processing.
The segment is also supported by the need for reliable performance and compliance with data regulations. On premises solutions ensure consistent operation and reduce dependency on external platforms, which supports adoption across retail environments.
Large enterprises accounted for 70.4% of the market. This segment dominates because large organizations operate multiple stores and locations, requiring advanced analytics to monitor customer behavior across sites. Heatmap solutions help them standardize insights and improve operational efficiency.
The segment is driven by higher investment capacity and strong focus on performance optimization. Large enterprises adopt analytics tools to enhance decision making, improve store design, and increase overall business efficiency.
By End User Analysis
Shopping malls represented 34.5% of the market. This segment leads because malls require detailed insights into visitor movement to manage crowd flow, tenant placement, and overall customer experience. Heatmap analytics helps optimize space utilization and improve foot traffic management.
The segment is supported by increasing need for better space planning and operational efficiency. Mall operators use these solutions to analyze visitor behavior, enhance layout strategies, and improve engagement across retail environments.
Investor Type Impact Analysis
Investor Type Growth Sensitivity Risk Exposure Geographic Focus Investment Outlook Venture Capital Firms High High North America, APAC Focus on AI-driven analytics startups Private Equity Firms Medium Medium Global Invest in scalable analytics platforms Corporate Investors High Low Global Strategic alignment with retail and smart infra Institutional Investors Medium Low North America, Europe Preference for stable and mature solution providers Impact Investors Medium Medium Europe, APAC Interest in smart city and urban optimization projects Technology Enablement Analysis
Technology Enabler Impact on CAGR Forecast (~%) Geographic Relevance Impact Timeline Implementation Significance AI-powered video analytics +2.0% Global Mid Term Improves accuracy of behavioral tracking Cloud-based analytics platforms +1.7% Global Short to Mid Term Enables scalable and real-time data processing IoT sensors and smart cameras +1.5% APAC, North America Short to Mid Term Enhances real-time footfall data collection Edge computing for real-time insights +1.3% North America, Europe Mid Term Reduces latency and improves responsiveness Integration with retail POS and CRM systems +1.2% Global Mid to Long Term Enables unified customer analytics ecosystem Key Challenges
- Data accuracy is a major challenge because footfall heatmap analytics depends on reliable tracking of customer movement, dwell time, and path patterns inside busy spaces.
- Privacy concerns remain important because these systems may collect location and behavior related data that must be handled carefully and in line with data protection rules.
- Integration with cameras, sensors, Wi Fi systems, and retail software can be difficult, especially when businesses use older or mixed technology setups.
- Interpreting the data correctly can be challenging because high traffic in one area does not always mean strong customer interest or higher sales.
- Cost can limit adoption because businesses may need to invest in hardware, software, analytics tools, and ongoing system maintenance to get useful results.
Emerging Trends
A key trend in the Footfall Heatmap Analytics market is the growing use of visual data mapping tools that track movement patterns within physical spaces. These systems convert visitor activity into heatmaps that show high and low engagement areas across stores, malls, and public venues.
Businesses use this insight to improve layout design, product placement, and crowd management. This trend reflects a shift toward using location based analytics to better understand how people interact with physical environments in real time.
Growth Factors
The increasing focus on improving customer experience and space utilization is supporting the growth of footfall heatmap analytics solutions. Retailers and facility managers aim to understand visitor behavior to optimize store layouts and reduce congestion.
These tools help identify patterns that support better decision making and improve operational efficiency. At the same time, rising adoption of smart infrastructure encourages the use of analytics platforms that provide actionable insights into how spaces are used across different environments.
Key Market Segments
By Component
- Software
- Hardware
- Services
By Application
- Retail
- Transportation
- Hospitality
- Healthcare
- Banking
- Others
By Deployment Mode
- On-Premises
- Cloud
By Organization Size
- Small and Medium Enterprises
- Large Enterprises
By End-User
- Shopping Malls
- Airports
- Stadiums
- Hospitals
- Banks
- Others
Regional Analysis
North America accounted for 38.3% of the Footfall Heatmap Analytics Market, reflecting strong adoption of data driven customer behavior analysis across retail, shopping malls, and public venues. Businesses across the region increasingly use heatmap analytics to understand movement patterns, optimize store layouts, and improve customer engagement. The growing focus on enhancing in store experience and maximizing space utilization continues to drive demand for advanced footfall analytics solutions across North America.
The U.S. generated about USD 0.69 Billion within the regional market and is projected to expand at a CAGR of 15.2%. Retailers and commercial facility operators across the country continue to invest in analytics tools that provide insights into visitor flow and dwell time.
These platforms help improve merchandising strategies, staffing decisions, and overall operational efficiency. As competition in physical retail intensifies and businesses seek to improve performance through data insights, demand for footfall heatmap analytics solutions continues to grow steadily across the US market.
Key Regions and Countries
- North America
- US
- Canada
- Europe
- Germany
- France
- The UK
- Spain
- Italy
- Russia
- Netherlands
- Rest of Europe
- Asia Pacific
- China
- Japan
- South Korea
- India
- Australia
- Singapore
- Thailand
- Vietnam
- Rest of APAC
- Latin America
- Brazil
- Mexico
- Rest of Latin America
- Middle East & Africa
- South Africa
- Saudi Arabia
- UAE
- Rest of MEA
Competitive Analysis
The competitive landscape of the Footfall Heatmap Analytics market includes companies that specialize in people counting, in store movement tracking, and customer behavior analysis. RetailNext, ShopperTrak (Sensormatic Solutions), V-Count, Dor Technologies, Countwise, Xovis, FootfallCam, Irisys, Trax, and Brickstream (FLIR Systems) hold strong positions because they offer tools that help retailers and commercial spaces measure visitor traffic, understand movement patterns, and improve store layout decisions. These companies compete through tracking accuracy, real time analytics, and ease of deployment.
Other players such as Springboard, Sensalytx, Kepler Analytics, Scanalytics Inc., Walkbase (Stratacache), Placer.ai, Density Inc., People Counting Systems (PCS), Gazelle.ai, and Pygmalios add competition through AI based analytics, heat mapping, and occupancy insight tools.
The market is shaped by data accuracy, privacy support, software integration, and the ability to turn footfall data into useful business decisions. Overall, companies compete by improving analytics depth, reporting quality, and customer insight.
Top Key Players in the Market
- RetailNext
- ShopperTrak (Sensormatic Solutions)
- V-Count
- Dor Technologies
- Countwise
- Xovis
- FootfallCam
- Irisys
- Trax
- Brickstream (FLIR Systems)
- Springboard
- Sensalytx
- Kepler Analytics
- Scanalytics Inc.
- Walkbase (Stratacache)
- Placer.ai
- Density Inc.
- People Counting Systems (PCS)
- Gazelle.ai
- Pygmalios
- Others
Future Outlook
The future outlook for the Footfall Heatmap Analytics Market looks strong as retailers, malls, and other physical spaces increasingly use heatmaps to understand customer movement, identify busy and low traffic zones, improve store layout, and plan staffing more effectively.
Current industry use cases show that heatmap and footfall analytics are already helping businesses improve product placement, customer flow, and space utilization in real time and through historical traffic analysis. As businesses focus more on customer behavior, operational efficiency, and smarter location planning, demand for footfall heatmap analytics solutions is expected to grow steadily in the coming years.
Recent Developments
- March, 2026 – RetailNext adds 6G edge AI for 3D heatmaps in 5,000 US stores and tracks shelf dwell. Boosts conversion 15% and partners Walmart with real-time staff tweaks. Adds AR planogram overlays and sells anonymized data to CPG brands for stocking.
- February, 2026 – Sensormatic 20/20 maps multi-floor malls with 99.5% accuracy and links sales to traffic. Serves 10K sites and adds weather-adjusted forecasts. Integrates POS data for basket insights and pilots hybrid work office flows.