


Report Overview
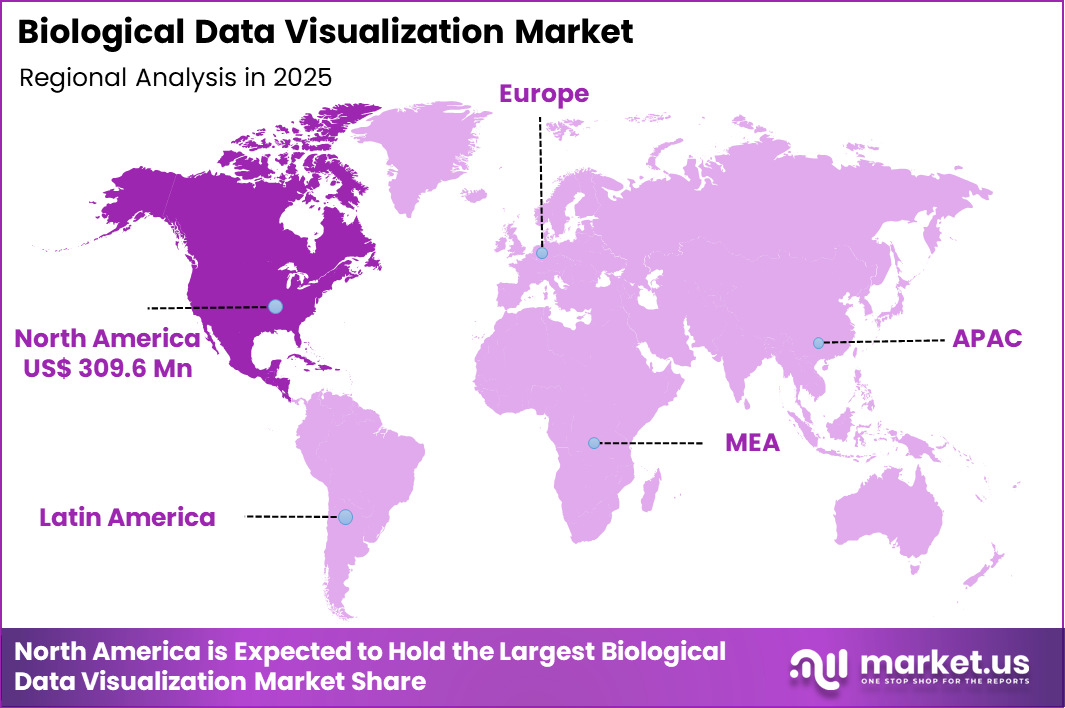
The Global Biological Data Visualization Market size is expected to be worth around US$ 1658.6 Million by 2035 from US$ 694.2 Million in 2025, growing at a CAGR of 9.1% during the forecast period 2026-2035. In 2025, North America led the market, achieving over 44.6% share with a revenue of US$ 309.6 Billion.
Growing demand for interpretable insights from complex biological datasets propels the Biological Data Visualization market as researchers and pharmaceutical companies require sophisticated tools to transform high-dimensional omics data into actionable knowledge.
Scientists increasingly employ interactive heatmaps and volcano plots in transcriptomics studies to identify differentially expressed genes in cancer subtypes, enabling rapid prioritization of therapeutic targets for precision oncology programs.
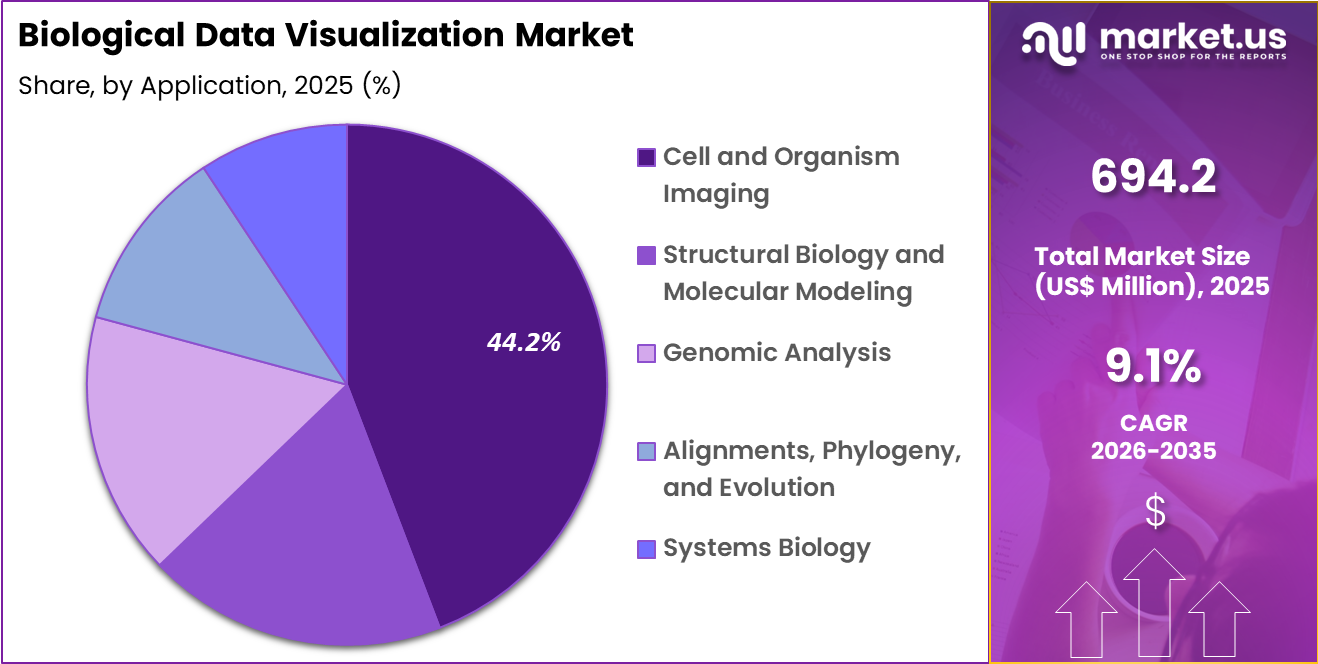
Sequencing accounted for 42.6% of growth within technique and dominate the biological data visualization market due to the massive expansion of genomic data generated through next-generation sequencing technologies. Research institutions and biotechnology companies increasingly rely on sequencing platforms to analyze DNA, RNA, and epigenetic information at high throughput. The National Human Genome Research Institute highlights that sequencing costs have dropped dramatically over the past decade, which has accelerated genomic data generation worldwide. Scientists use advanced visualization tools to interpret complex genomic datasets, identify mutations, and understand genetic variation. The segment is expected to expand as precision medicine initiatives and population genomics projects continue to grow globally. Increasing integration of sequencing data with bioinformatics platforms is likely to strengthen the demand for advanced visualization tools. Cell and organism imaging accounted for 44.2% of growth within application and dominate the biological data visualization market due to the increasing use of high-resolution imaging technologies in biological research. Researchers analyze cellular structures, tissue organization, and organism-level biological processes using microscopy and imaging platforms. Visualization tools help scientists interpret large image datasets and extract meaningful biological insights. Advances in imaging technologies such as confocal microscopy and live-cell imaging generate complex datasets that require advanced visualization techniques. The segment is projected to grow as biological research increasingly focuses on understanding cellular behavior and disease mechanisms. Rising adoption of imaging-based research in drug discovery and life sciences is expected to further drive demand for visualization solutions. Windows accounted for 70.3% of growth within platform and dominate the biological data visualization market due to its widespread adoption across research institutions, laboratories, and healthcare organizations. Many bioinformatics and visualization software solutions are designed primarily for Windows environments due to compatibility and user familiarity. Research facilities and academic institutions frequently deploy Windows-based systems because they support a wide range of analytical tools and computational software. The platform is expected to maintain its dominance as laboratories continue to rely on standardized operating environments for data analysis and visualization workflows. Increasing integration of visualization tools with enterprise IT infrastructure further strengthens Windows adoption in research settings. Academic research accounted for 68.4% of growth within end use and dominate the biological data visualization market due to the strong focus on scientific discovery and data-driven research across universities and research institutes. Academic institutions generate large volumes of biological data through genomics, proteomics, and imaging studies. Researchers depend on advanced visualization tools to interpret complex datasets and communicate findings effectively. Government funding agencies such as the National Institutes of Health continue to support large-scale biological research projects, which increases demand for data analysis and visualization tools. The segment is anticipated to expand as academic research programs continue to grow and generate increasingly complex biological datasets. These pressures can slow system expansion and limit adoption in smaller research environments. At the same time, organizations prioritize efficient data interpretation and invest in integrated visualization platforms to accelerate insights. Growing reliance on data-intensive biology and precision medicine continues to support strong long-term demand. Increased adoption of cloud-based collaborative visualization platforms is driving the market. Cloud-hosted solutions have gained prominence for enabling real-time collaborative exploration of biological datasets among distributed research teams. These platforms provide scalable computing resources for rendering large-scale visualizations without local hardware constraints. The 2024-2025 period reflects growing utilization in multi-institutional consortia projects requiring shared access to unified views. Researchers benefit from version control and annotation features for joint interpretation sessions. The trend aligns with institutional policies promoting open science through accessible data sharing environments. Facilities report reduced infrastructure maintenance burdens compared to on-premises deployments. The development supports integration with public repositories for seamless import of reference datasets. Early implementations demonstrate enhanced productivity in cross-disciplinary collaborations. The increased deployment accelerates knowledge dissemination across global research networks. Overall, this cloud transition strengthens accessibility and interactivity in biological data interpretation. North America is leading the Biological Data Visualization Market North America accounted for 44.6% of the biological data visualization market in 2025 as research institutions, pharmaceutical companies, and healthcare organizations expanded use of advanced analytics platforms to interpret complex biological datasets.The rapid growth of genomics, proteomics, and clinical data generation across the United States and Canada has created strong demand for tools that convert large-scale datasets into meaningful visual insights. According to the National Human Genome Research Institute, the cost of sequencing a human genome fell to around USD 600 in 2023, significantly increasing the volume of genomic data generated and strengthening the need for advanced visualization solutions. Life sciences companies are increasingly using visualization platforms to support drug discovery, biomarker identification, and precision medicine research. Academic institutions are integrating data visualization tools into bioinformatics and computational biology programs to enhance research capabilities. Healthcare providers are also adopting these technologies to analyze patient data and improve clinical decision-making. Cloud computing and high-performance data processing technologies have enabled faster and more scalable visualization of large biological datasets. Technology companies are developing interactive platforms that allow researchers to explore multi-dimensional data in real time. These developments collectively supported strong growth of biological data visualization solutions across North America in 2025. The Asia Pacific region is expected to experience the highest CAGR during the forecast period Asia Pacific is expected to experience strong expansion during the forecast period as biotechnology research and digital health initiatives accelerate across the region. Countries such as China, Japan, South Korea, and India are investing heavily in genomics research, biomedical data analytics, and precision medicine programs. China’s National Bureau of Statistics reported that research and development spending reached about 3.09 trillion yuan in 2022, supporting large-scale data-driven research initiatives across life sciences. Research institutions and biotechnology companies across the region are generating vast volumes of genomic and clinical data that require advanced visualization tools for analysis and interpretation. Governments are promoting national genomics programs and digital health strategies that encourage data integration and scientific collaboration. Universities are expanding bioinformatics and data science programs that train researchers in advanced analytical and visualization techniques. Pharmaceutical companies are adopting data visualization platforms to improve drug discovery efficiency and clinical research outcomes. Cloud-based analytics platforms are enabling researchers to process and visualize complex datasets more efficiently across distributed research environments. These developments are expected to accelerate adoption of biological data visualization technologies throughout Asia Pacific in the coming years.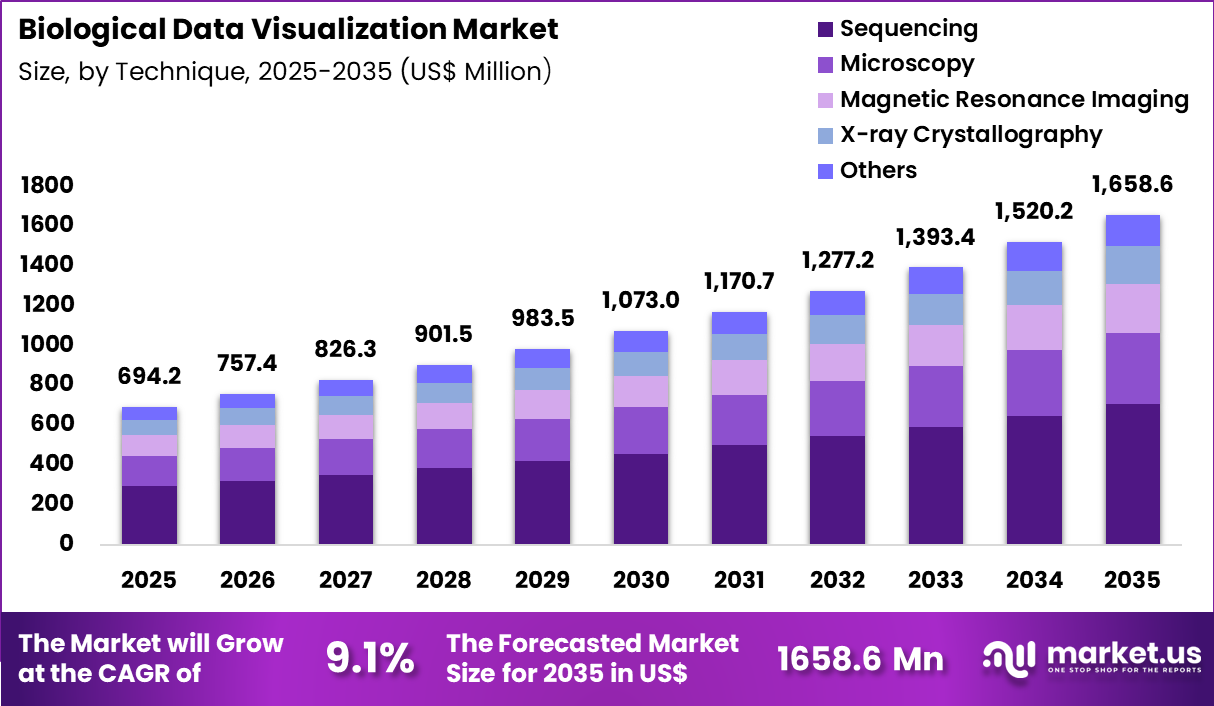
Key Takeaways
Technique Analysis
Application Analysis
Platform Analysis
End-Use Analysis
Latest Trends
Regional Analysis
Top Key Players
Recent Developments









