


Report Overview
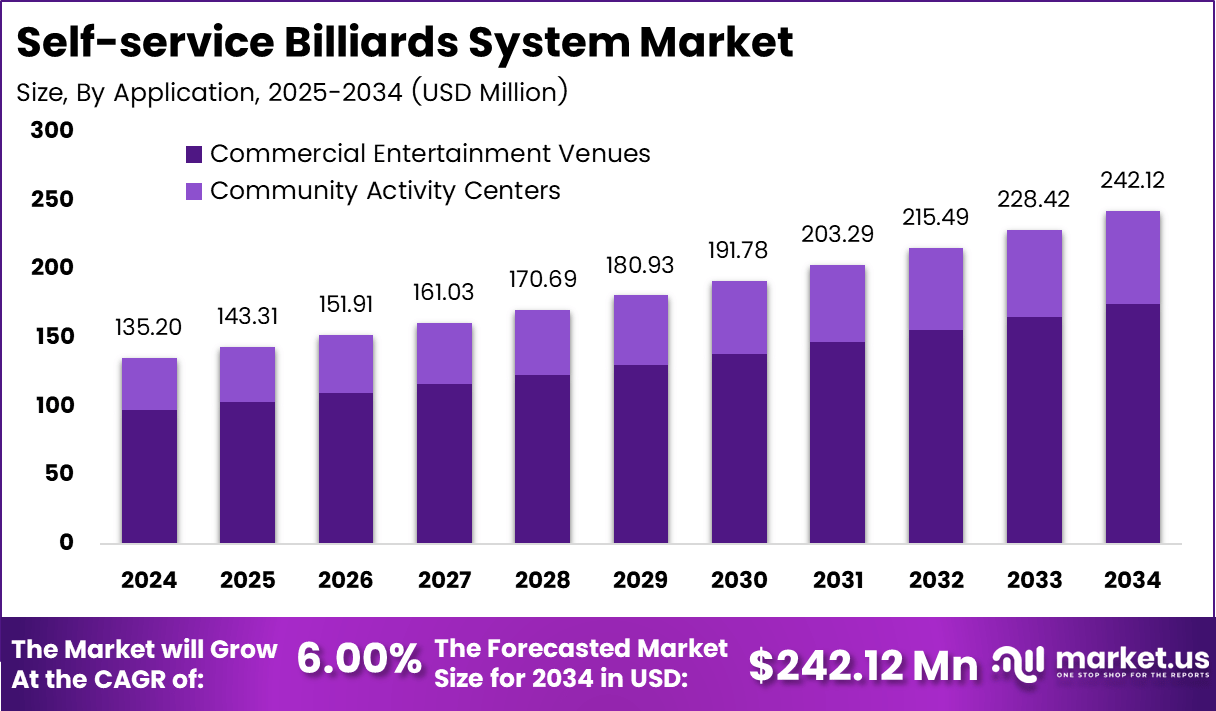
The Global Self-Service Billiards System Market reached USD 135.2 million in 2024 and is projected to expand steadily at a 6.0% CAGR from 2025 to 2034, ultimately hitting USD 242.12 million by 2034.
The Asia Pacific region dominates the global landscape with 48.90% share , holding the largest regional share, valued at USD 66.1 million, reflecting strong adoption across entertainment venues and tech-enabled leisure spaces. Commercial entertainment venues remain the core revenue generator, consistently accounting for the majority of annual market value from 2024 through 2034.
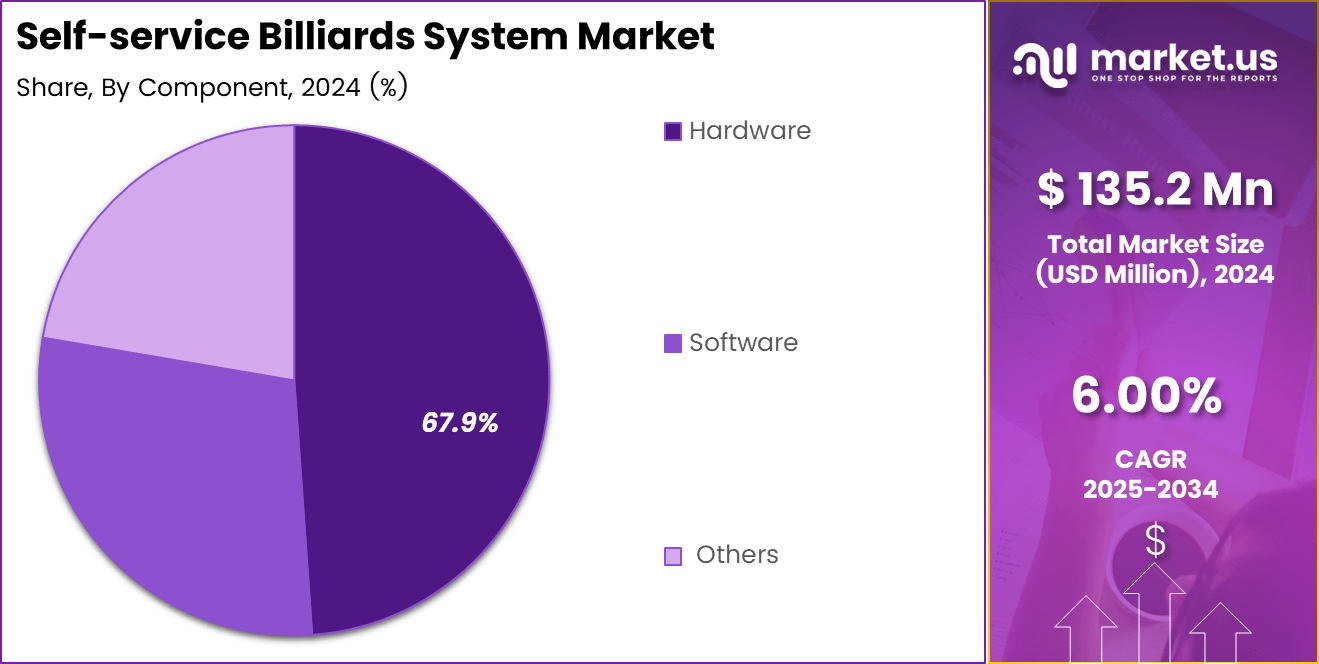
Component analysis highlights hardware as the leading category with a 67.9% share in 2024, emphasizing the industry’s dependence on automated pool-table systems, sensors, payment modules, and integrated control units that support streamlined customer use. Self-service billiards systems are automated, unattended pool-table solutions designed to streamline game access, usage tracking, and payments without staff involvement.
These systems typically integrate digital kiosks, smart hardware modules, time-tracking sensors, and software interfaces that allow users to start and end a session independently. They enhance operational efficiency for venue owners by reducing labor requirements while offering players a faster, more convenient gameplay experience. Widely deployed in entertainment venues and community activity centers, these systems support modern, tech-driven recreational environments and help maximize table turnover, improve revenue management, and provide real-time monitoring of equipment usage.
Key Takeaways
- Hardware accounted for 67.9% of the global market in 2024, making it the dominant component due to the rising installation of automated billiards tables, integrated payment modules, and sensor-based usage tracking systems.
- Software contributed a smaller share, supported by increasing demand for digital interfaces, billing dashboards, and remote monitoring tools across modern leisure venues.
- The Others segment held the remaining proportion, including accessories, add-ons, and supporting technological components used in system integration.
- Commercial Entertainment Venues dominated the application landscape with 72.2% share, driven by expanding adoption across gaming lounges, sports bars, malls, and entertainment chains seeking automation for cost-efficient operations.
- Community Activity Centers captured the remaining market share, supported by growing interest in tech-enabled recreational activities within public and semi-public spaces.
- Asia Pacific emerged as the largest regional marketwith 48.90% Share, reaching USD 66.1 million, supported by the rapid expansion of entertainment infrastructure and high acceptance of automated recreational technologies.
- The global market grew to USD 135.2 million in 2024, with a forecast to reach USD 242.12 million by 2034 at a 6.00% CAGR, reflecting steady adoption of self-service recreational solutions.
Analysts’ Viewpoint
Analysts observe that the self-service billiards system market is entering a steady growth phase, supported by increasing automation across recreational venues. The self-service billiards system market reached USD135.2 million in 2024 and is projected to climb to USD 242.12 million by 2034, growing at a 6.00% CAGR, which reflects expanding adoption of unattended entertainment technologies. Hardware’s dominant 67.9% share signals that venue operators continue to prioritize smart tables, integrated payment systems, and advanced sensor modules.
The strong 72.2% share held by Commercial Entertainment Venues indicates a clear shift toward labor-efficient, self-directed leisure formats, especially in malls, gaming lounges, and premium cafés. Asia Pacific’s leadership with 48.90% Share at USD 66.1 million demonstrates how rising disposable incomes and vibrant social entertainment cultures amplify market penetration. Analysts anticipate that the ongoing digitalization of recreational spaces, combined with operators’ focus on cost optimization and user convenience, will keep the market on a stable upward trajectory over the next decade.
Investment and Business Benefits
Investment Point of View
- Provides exposure to a growing automation-focused recreational technology segment.
- Offers long-term value through recurring revenues from system upgrades and maintenance.
- Carries lower operational risk due to the shift toward unattended entertainment models.
- Aligns with rising investor interest in digital leisure infrastructure and tech-enabled venues.
- Enhances portfolio diversification with a stable, service-driven technology asset class.
- Attracts sustained demand from entertainment chains and modern recreational spaces.
Business Point of View
- Reduces staffing needs by automating table access, usage tracking, and payments.
- Improves operational efficiency with standardized, digital management of billiards tables.
- Increases table turnover and overall revenue consistency through automated controls.
- Enhances customer experience with instant access and self-directed play.
- Minimizes billing errors and simplifies maintenance scheduling through integrated software.
- Supports scalable expansion for gaming lounges, malls, cafés, and entertainment venues.
- Strengthens competitive positioning by offering modern, tech-forward recreational services.
Regional Analysis
The self-service billiards system market is expanding steadily, reaching USD 135.2 million in 2024 and projected to advance to USD 242.12 million by 2034 at a 6.00% CAGR, driven by the growing shift toward automated recreational formats. The increasing modernization of entertainment venues, gaming lounges, cafes, and malls continues to strengthen demand for unattended, sensor-based billiards systems, supported by integrated software for billing and monitoring.
Asia Pacific dominates regionally with a 48.90% market share, valued at USD66.1 million in 2024, far surpassing all other regions in adoption. Strong urban entertainment ecosystems, rising disposable incomes, and the popularity of digital leisure activities reinforce APAC’s dominance.
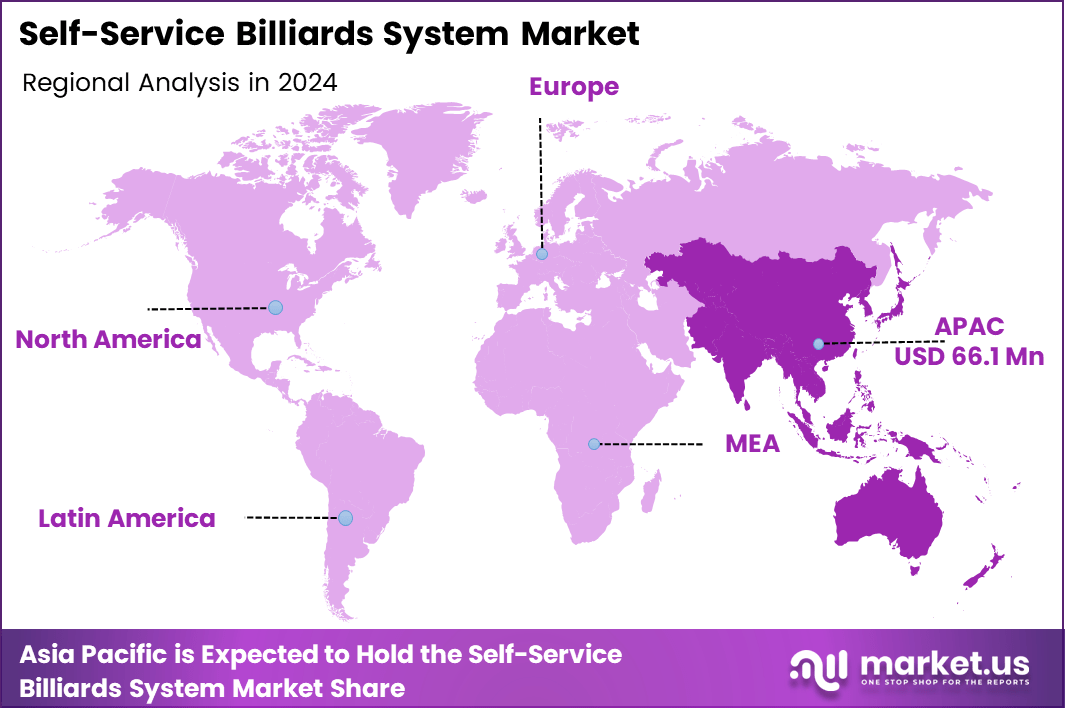
Businesses in this region increasingly prefer automated solutions to reduce labor dependence and improve operational efficiency. With hardware holding the largest component share and commercial entertainment venues accounting for the majority of applications, APAC remains the core growth engine shaping the global trajectory of this self-service billiards system market.
By Component
Hardware leads the component landscape with 67.9%, supported by strong adoption of automated billiards tables, sensor-based timing systems, and integrated payment modules that enable fully unattended operation. Venues prioritize reliable, durable hardware because it ensures consistent performance and reduces staffing needs.
Software adds value by managing billing, monitoring gameplay duration, and offering administrative dashboards that streamline venue operations. The Others segment includes supporting accessories, add-on modules, and integration components that enhance customization and long-term maintenance efficiency. Together, these categories form a balanced ecosystem where hardware remains the primary driver of system deployment.
By Application
Commercial Entertainment Venues dominate with 72.2%, driven by growing modernization across gaming lounges, cafés, malls, and sports bars seeking automated recreational formats. Automation supports higher table turnover, reduced labor costs, and improved user experience, making these venues the strongest adopters. Community Activity Centers form the remaining share, benefiting from flexible, self-directed recreational access suited for group activities and public spaces.
Key Market Segments
By Component
- Software
- Hardware
- Others
By Application
- Commercial Entertainment Venues
- Community Activity Centers
Key Regions and Countries
- North America
- US
- Canada
- Europe
- Germany
- France
- The UK
- Spain
- Italy
- Rest of Europe
- Asia Pacific
- China
- Japan
- South Korea
- India
- Australia
- Singapore
- Rest of Asia Pacific
- Latin America
- Brazil
- Mexico
- Rest of Latin America
- Middle East & Africa
- South Africa
- Saudi Arabia
- UAE
- Rest of MEA
Emerging Trends
The self-service billiards system market is experiencing steady transformation as venues shift toward digitally managed recreational formats. One of the strongest trends is the adoption of smart hardware equipped with improved sensors, automated timing controls, and integrated payment units, allowing operators to run billiards tables with minimal staff involvement. Another trend is the rise of cloud-based management platforms that help venues track usage, manage bookings, and monitor performance in real time.
For instance, many entertainment facilities now prefer software dashboards that simplify billing and maintenance scheduling. There is also growing interest in pairing billiards systems with mobile applications so users can initiate play, make payments, or receive updates directly from their phones. Community activity centres and co-working spaces are emerging as new adoption hotspots, where unattended recreational options fit well with flexible access models. These trends collectively indicate a long-term shift toward more connected, automated, and user-friendly self-service environments.
Top 5 Use Cases
- Gaming lounges rely on automated tables to handle high usage levels, supported by the strong 72.2% share of commercial entertainment venues.
- Sports bars and cafes adopt self-service systems to manage consistent foot traffic in a market growing at a 6.00% CAGR.
- Malls and entertainment centres use automated tables as low-staff attractions, aligned with hardware’s leading 67.9% share.
- Community activity centres benefit from unattended recreational access, helping expand adoption beyond commercial venues.
- Residential and co-living spaces add self-service billiards as a modern amenity, reflecting rising demand for tech-enabled leisure options.
Driver Analysis
Rise of automated venue operations
Industry publications consistently point out that entertainment venues are moving toward self-service models to reduce labour dependence and improve operational efficiency. Many operators now prefer automated billiards systems because they manage session timing, payments, and access without constant staff involvement. Research covering commercial recreation formats notes that operators adopting automation tend to achieve smoother operations and consistent table availability.
For instance, several entertainment chains reviewed in sector studies found that self-service tables helped them extend hours and reduce staffing fluctuations. This shift also aligns with consumer expectations for quick, digital access. As a result, automation becomes an attractive driver for both cost control and user convenience.
Restraint Analysis
High installation cost and system complexity
Recreational-facility cost analyses often emphasise that high upfront expenses remain a barrier for small and mid-size venues. Automated billiards systems require hardware installation, sensor calibration, and payment integration, which raises total investment cost. Reports examining profitability in leisure businesses indicate that tight margins make operators cautious about adopting high-capital systems.
For instance, smaller venues highlighted in self-service billiards system market assessments often delay automation because they fear slow payback or limited footfall. The need for technical setup, periodic maintenance, and reliable support services adds another layer of complexity. As a result, cost-sensitive operators may postpone upgrades, slowing market expansion.
Opportunity Analysis
Expansion into community spaces and new regions
Recreation infrastructure studies show a growing opportunity in community activity centres, co-working hubs, and residential complexes that seek flexible, unattended entertainment options. These spaces often lack dedicated staff, making automated billiards systems a suitable fit. Market commentary from regional development bodies highlights increasing interest in shared recreational areas that rely on access-controlled self-service systems.
For instance, a community facility with limited staffing hours can extend gameplay availability by installing automated tables. Additionally, emerging urban regions with rising leisure participation but limited automation penetration offer strong expansion prospects. Tailoring systems to local needs gives vendors a chance to establish early leadership.
Growth Factor
Growth in the self-service billiards system market is supported by the strong shift toward automated entertainment experiences, with hardware accounting for 67.9% of the total market share. This dominance reflects the industry’s preference for sensor-based tables, integrated timing units, and digital payment modules that reduce labour needs and improve operational efficiency. The self-service billiards system market’s steady expansion is also shaped by a 6.00% CAGR, showing that venues continue to invest in systems that streamline customer flow and increase table turnover.
Another important factor is the strong demand from commercial entertainment venues, which represent 72.2% of the application share. Their high traffic levels and long operating hours create ideal conditions for self-service systems to replace manual management.
For instance, gaming lounges and cafés adopting automated tables report smoother operations and better utilisation rates. The growing acceptance of self-service technology among younger audiences further strengthens market adoption, as they prefer quick access and cashless interactions. Advances in hardware durability, smarter software dashboards, and mobile-friendly booking features continue to push the market forward, ensuring sustained growth over the coming years.
SWOT Analysis
Strengths
- Automated operation reduces staffing needs and supports longer operating hours.
- Consistent user experience through accurate time tracking and digital payment systems.
- High attractiveness for modern entertainment venues seeking tech-driven upgrades.
- Strong fit for both large commercial spaces and smaller community facilities.
Weaknesses
- High initial setup cost for hardware, sensors, and integration components.
- Requires stable software updates and timely technical maintenance.
- Limited adoption in budget-constrained venues with low footfall.
- Some operators face learning curves when shifting from manual to automated systems.
Opportunities
- Expansion into community centres, co-working hubs, and residential recreation areas.
- Growth potential in emerging regions with rising leisure infrastructure.
- Ability to integrate with mobile apps, digital wallets, and booking platforms.
- Rising consumer interest in self-service entertainment formats.
Threats
- System downtime or technical failures can impact user satisfaction.
- Competition from traditional billiards halls that operate with low costs.
- New recreational trends may divert consumer attention.
- Lack of strong vendor support can slow long-term adoption.
Key self-service billiards system Insights
24Billiards strengthens its position by offering modular automated billiards systems that align with venues upgrading to self-service formats, supported by durable hardware and ease of deployment. Bilijardai JSC blends traditional craftsmanship with automation, giving it an edge in markets valuing both design quality and modern functionality.
Olhausen Billiard Manufacturing Inc. benefits from strong brand recognition, helping its gradual entry into automated solutions gain trust among premium venues. AE Schmidt Billiards focuses on custom designs adapted for automated operation, appealing to venues seeking aesthetic value alongside efficient, low-staff gameplay management.
Top Key Players
- 24Billiards
- Bilijardai JSC
- Olhausen Billiard Manufacturing, Inc.
- AE Schmidt Billiards
- Craftmaster Billiards, Inc.
- Dynamic Billard Organization GmbH
- Others
Recent Development
- December 2024 – A major US-based entertainment operator announced its rebrand and expansion strategy, which involved acquiring multiple high-traffic venues, including water parks and family entertainment centres. This move reflects how venue owners are seeking to diversify their attractions and integrate digital, unattended gaming solutions, thereby creating favorable conditions for suppliers of self-service billiards systems to leverage new venue footprints.
- July 2025 – The same operator followed up with another acquisition cycle targeting two iconic water parks and three established family entertainment centres in North America. This illustrates how location-based entertainment groups are consolidating assets and investing in modern guest experiences, including automated, low-staff recreational offerings. Such trends support increasing demand for systems that enable independent access and digital payment for billiards and similar leisure activities.









