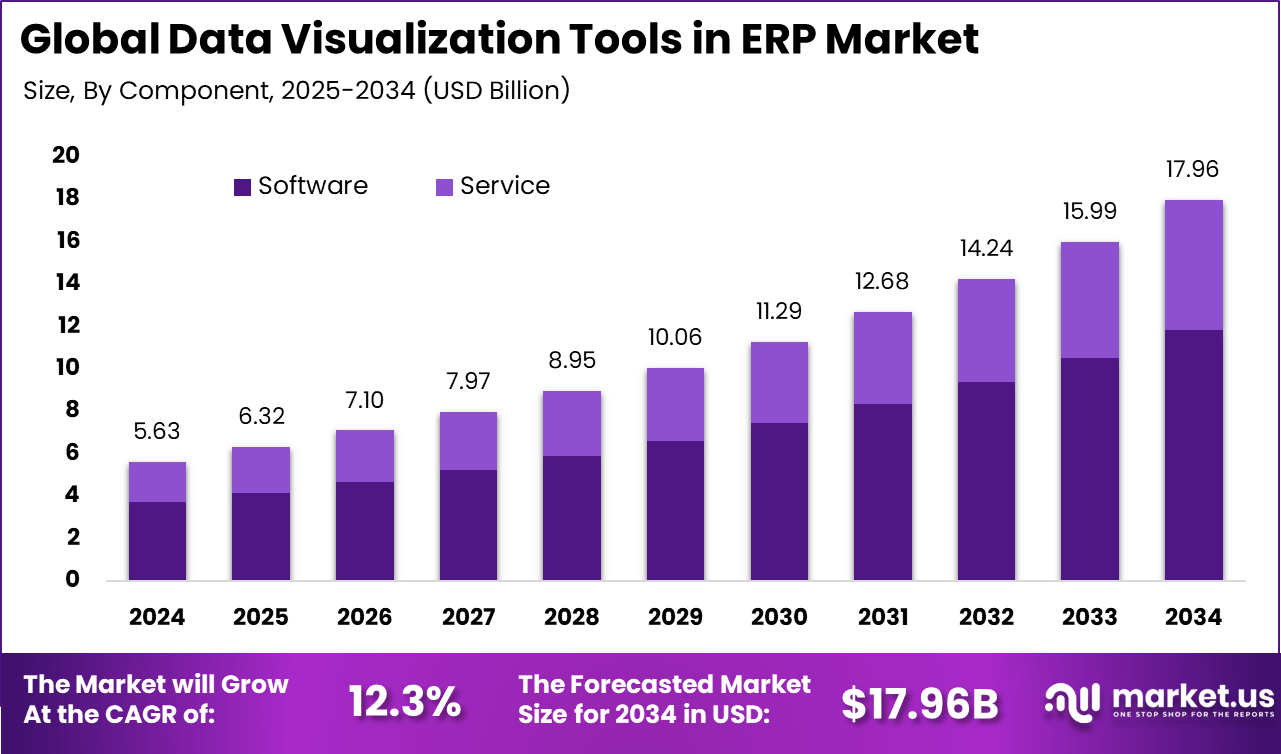
| In 2024, North America held a dominant market position in the Global Data Visualization Tools in ERP Market, capturing more than a 42.6% share, holding USD 2.39 billion in revenue. This dominance is due to its advanced tech infrastructure, widespread cloud-based ERP adoption, and a strong data-driven decision-making culture.
The presence of major tech players, significant investments in digital transformation, and a robust analytics ecosystem further boosted market growth. North American businesses’ focus on real-time analytics, regulatory compliance, and maintaining a competitive edge drove the demand for sophisticated data visualization tools, with U.S. giants like Microsoft, IBM, and AWS leading innovation.
For instance, in September 2024, IBM Planning Analytics, integrated with IBM Cognos Analytics, provided a scalable solution for enterprise growth in North America. By seamlessly connecting with ERP systems, this platform created a unified planning ecosystem that enabled real-time forecasting, scenario modeling, and enhanced data visualization.
Component Analysis
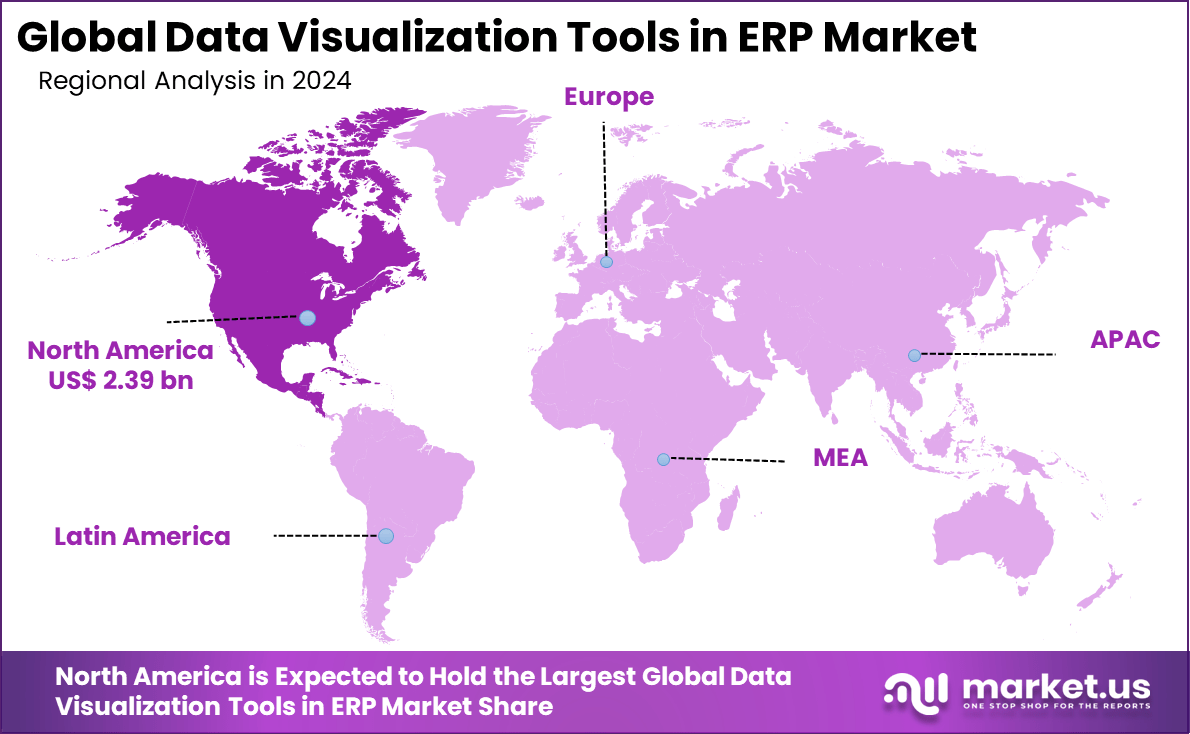
In 2024, Software segment held a dominant market position, capturing a 65.8% share of the Global Data Visualization Tools in ERP Market. This dominance is due to the increasing demand for advanced, scalable, and user-friendly data visualization solutions that integrate seamlessly with ERP systems.
The software offers organizations a range of functionalities to explore real-time data, provide user-friendly dashboards, and offer flexible reporting that is necessary for making informed decisions. Additionally, the rise of cloud-based solutions and the integration of AI/machine learning have further strengthened competition in the software industry.
For Instance, in January 2025, Diligent’s SuiteApp, Diligent Boards for NetSuite, achieved ‘Built for NetSuite’ certification, integrating governance, risk, and compliance (GRC) functionalities with NetSuite’s ERP capabilities to enhance board reporting and financial oversight. This integration allows organizations to securely share key financial, risk, compliance, audit, and ESG insights with leadership, ensuring effective oversight.
Application Analysis
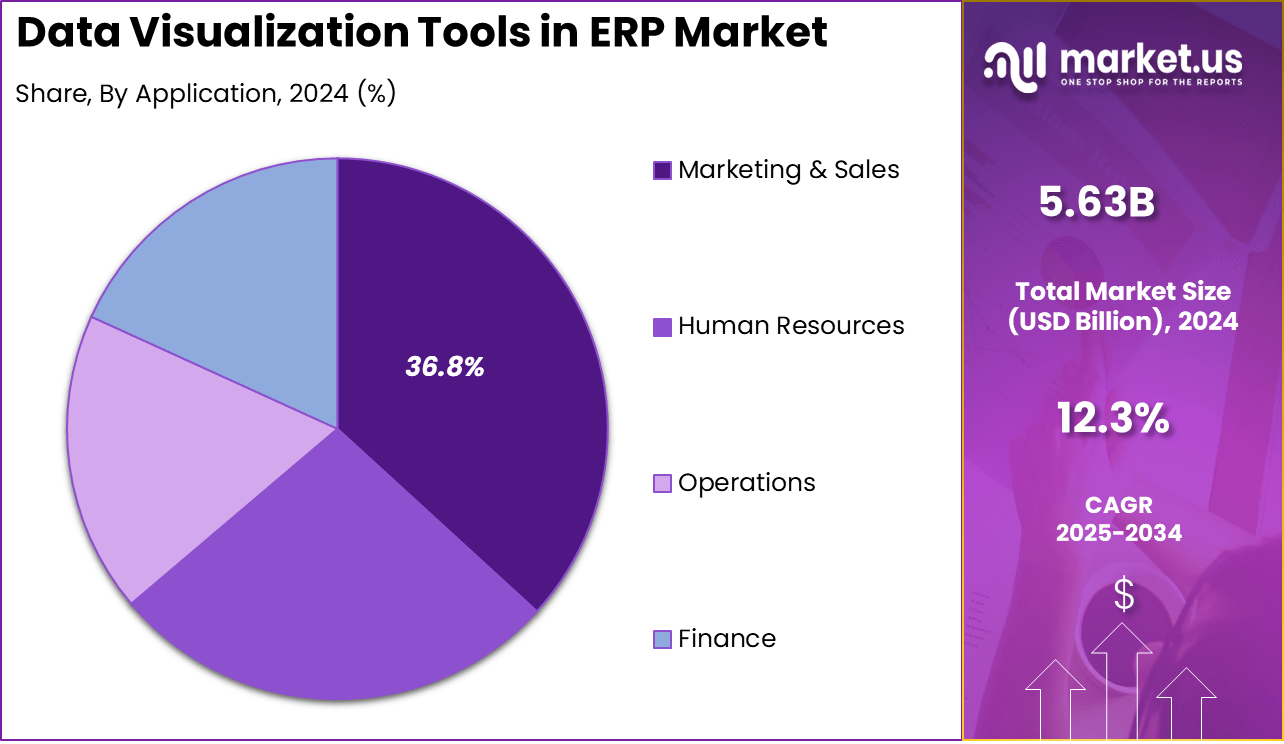
In 2024, Marketing & Sales segment held a dominant market position, capturing a 36.8% share of the Global Data Visualization Tools in ERP Market. This demand is driven by the growing need for data-driven insights to optimize campaigns, refine sales strategies, and improve customer targeting.
Data visualization tools allow teams to quickly analyze complex data from various channels, providing real-time insights into customer behavior, sales trends, and marketing performance. This facilitates better decision-making and boosts overall effectiveness.
For instance, in August 2024, UK-based digital bank Monzo partnered with SAP and NTT DATA to implement the GROW with SAP solution, aiming to streamline its finance IT systems and fully embrace cloud technology. This collaboration integrates key business functions – including finance, sales, marketing, procurement, and HR – into a unified platform, enhancing operational efficiency and enabling data-driven decision-making.
Organization Size Analysis
In 2024, Large Enterprises segment held a dominant market position, capturing a 71.6% share of the Global Data Visualization Tools in ERP Market. This dominance is due to the increasing complexity of business operations and the need for sophisticated data analysis across a broad spectrum of sectors in major companies.
These organizations require effective data visualization tools to manage vast amounts of data, improve decision-making, and streamline business processes. The integration of data visualization with ERP systems empowers large enterprises to gain timely insights and maintain a competitive edge in their industry.
For Instance, in March 2022, Corsair, a leading global provider of high-performance gear for gamers and content creators, leveraged Oracle Fusion ERP Analytics to enhance its data visualization capabilities within its ERP system. By integrating finance and supply chain data across the company, Corsair has standardized and connected its analytics, enabling more informed decision-making and improved operational efficiency.
Industry Vertical Analysis
In 2024, The IT and Telecommunication segment held a dominant market position, capturing a 23.7% share of the Global Data Visualization Tools in ERP Market. This dominance is due to its reliance on vast amounts of complex data from network operations, customer usage, and service management.
These tools enable IT and telecom organizations to monitor system performance, optimize resource allocation, and enhance customer satisfaction through immediate insights. Additionally, the growing preference for digital transformation and the requirement to make swift, data-driven decisions in a competitive market have led to an increase in the use of advanced data visualization tools integrated with ERP systems.
For Instance, in June 2024, Precise Business Solutions emphasized the transformative role of data visualization in ERP systems, particularly within the IT and telecommunications sectors. By integrating advanced Business Intelligence (BI) tools with ERP platforms like Epicor Kinetic, organizations can convert complex data into intuitive visual narratives.
Key Market Segments
By Component
- Software
- Service
- Consulting Services
- Support Services
By Application
- Human Resources
- Operations
- Finance
- Marketing & Sales
By Organization Size
By Deployment
By Industry Vertical
- BFSI
- IT and Telecommunication
- Manufacturing
- Healthcare & Life Sciences
- Retail and E-commerce
- Government
- Transportation & logistics
- Others
Key Regions and Countries
- North America
- Europe
- Germany
- France
- The UK
- Spain
- Italy
- Russia
- Netherlands
- Rest of Europe
- Asia Pacific
- China
- Japan
- South Korea
- India
- Australia
- Singapore
- Thailand
- Vietnam
- Rest of Latin America
- Latin America
- Brazil
- Mexico
- Rest of Latin America
- Middle East & Africa
- South Africa
- Saudi Arabia
- UAE
- Rest of MEA
Emerging Trend
Embedded Visualization Inside ERP Workflows
One of the most notable trends in the ERP industry is the increasing integration of data visualization tools directly into the ERP interface. Traditionally, organizations relied on external BI tools to generate reports and dashboards, which often required switching between platforms and delayed insight generation.
However, newer ERP systems are now embedding real-time charts, alerts, and performance indicators within their dashboards. This helps ensure that users can access actionable insights in the same environment where transactions and operations occur.
The transition toward embedded visualization has allowed ERP users to become more agile. By reducing dependency on external tools and delivering instant data views, businesses can respond faster to changes in inventory, finance, or supply chain metrics.
Drivers
Rise of Self-Service Analytics in ERP
A key factor driving the adoption of visualization tools in ERP is the growing preference for self-service analytics across enterprises. Employees increasingly expect the ability to explore data on their own terms, without relying on IT teams.
This has encouraged ERP vendors to offer built-in tools with easy-to-use dashboards, simple drag-and-drop functionalities, and even voice or text-based query options. As these features become more common, more departments are independently using ERP data to manage daily operations.
This shift is making organizations more data-aware at every level. Decision-makers from finance, HR, and logistics can now interact with live data without learning complex coding or reporting software. The speed and independence this provides improve operational efficiency and reduce the bottlenecks often associated with centralized data teams.
Restraint
Lack of Data Standardization Across ERP Modules
Despite the growing interest in visual ERP tools, one of the biggest challenges remains the inconsistency of data across ERP modules. Modules such as sales, inventory, procurement, and accounting often follow different data formats, structures, or logic.
This fragmentation makes it difficult to present a unified dashboard, as some information may be misaligned or duplicated. Without a standard framework for data aggregation, visualization tools often produce incomplete or inaccurate representations.
As a result, many businesses are forced to invest in additional integration layers or data transformation services to clean and harmonize their ERP data. These steps increase the time and cost of deploying effective dashboards. Moreover, any change in the backend system may break existing visualizations, creating ongoing maintenance demands.
Opportunities
Integration with AI and Machine Learning
The integration of AI and ML into data visualization tools presents significant potential for growth in the ERP sector. AI-enabled tools can identify patterns, anomalies, and biases in business data without human intervention, providing insights that may not be available through traditional analysis.
AI and ML enhance predictive analytics, enabling organizations to anticipate trends and refine their operations. With the advancement of these technologies, firms can incorporate them into ERP systems and gain a competitive edge, which will improve their decision-making and operational efficiency.
For instance, in July 2025, Campfire, an AI-driven ERP startup, secured a $35 million Series A funding round led by Accel. The company is gaining traction among startups transitioning from traditional ERP systems like NetSuite, offering a more agile and cost-effective alternative. Campfire’s platform uses AI to automate accounting and offers clear data visuals, helping businesses make quick, informed decisions.
Challenges
Data Security and Privacy Concerns
With the increased reliance on data visualization tools in ERP systems, there are growing concerns around data security and privacy. Safeguarding confidential business information from unauthorized access, breaches, or cyberattacks is also essential.
The integration of data visualization tools with ERP systems often requires sharing vast amounts of data across multiple platforms, which increases the risk of exposure. Compliance with data protection laws, such as GDPR, is a significant challenge, forcing firms to prioritize the implementation of robust security measures to safeguard personal information.
For instance, in August 2024, a security vulnerability was discovered in Oracle NetSuite’s SuiteCommerce platform, exposing sensitive customer data on several e-commerce sites due to a misconfiguration in access controls. This incident shows the need for proper setup and access control in ERP platforms. Secure configuration of data visualization tools and APIs is vital to protect customer information.
Key Players Analysis
In 2024, Salesforce, Microsoft, and SAP led the ERP data visualization space with smart dashboards and built-in analytics. Their platforms simplify decision-making by showing real-time business insights directly within ERP systems. These tools use AI to improve accuracy and speed. The focus is on helping users find key information quickly without switching between tools. Their solutions support better planning and visibility.
Oracle, IBM, and Amazon Web Services strengthened their roles with cloud-based ERP visualization tools. These platforms are built to manage complex data and offer easy-to-read visual reports. Their tools help users cut reporting time and boost response speed. With a strong focus on security and scalability, these companies are preferred by large organizations needing high-volume data access.
Alibaba Cloud, TIBCO, SAS, and Sisense are known for their flexible and user-friendly visualization tools. They serve small and mid-sized companies looking for simple dashboard features and smooth ERP integration. These platforms support quick insights and are easy to customize. Their design allows users to view trends and reports with minimal training or technical skills.
Top Key Players in the Market
- Salesforce, Inc.
- Alibaba Cloud
- Oracle
- Amazon Web Services, Inc.
- SAS Institute Inc.
- Sisense Inc.
- Microsoft Corporation
- TIBCO software
- IBM
- SAP
- Others
Recent Developments
- In July 2025, Alibaba Cloud announced a strategic investment exceeding $60 million to accelerate AI innovation. This investment underscores Alibaba Cloud’s commitment to advancing AI technologies, which are integral to the development of sophisticated data visualization tools within ERP systems.
- In September 2024, Salesforce introduced Agentforce, a suite of autonomous AI agents designed to enhance enterprise data, ERP, and supply chain management. These AI agents leverage Salesforce’s Data Cloud to provide real-time, actionable insights, improving decision-making processes across various business functions.
|---|