


Report Overview
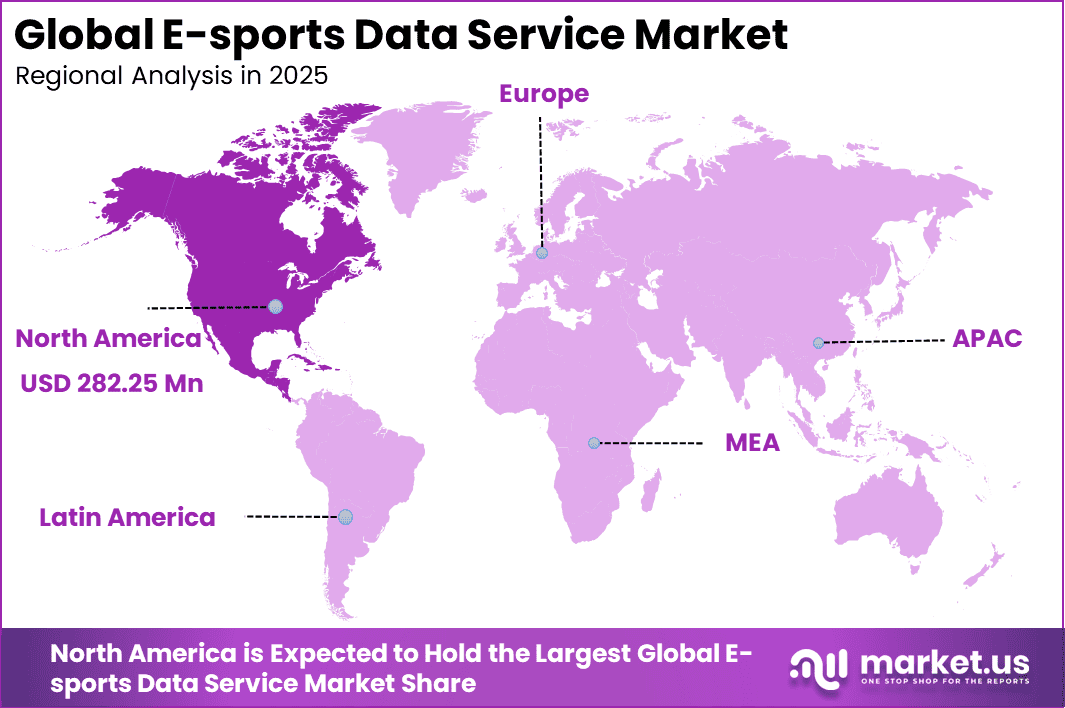
The Global E-sports Data Service Market size is expected to be worth around USD 2,223.0 million by 2035, from USD 678.5 million in 2025, growing at a CAGR of 12.6% during the forecast period from 2025 to 2035. North America held a dominant market position, capturing more than a41.6% share, holding USD 282.2 million in revenue.
The E-sports Data Service Market refers to platforms and services that collect, process, analyze, and distribute structured data generated from competitive gaming activities. This includes match statistics, player performance metrics, team analytics, audience behavior, and broadcast related data. These services support teams, leagues, media platforms, betting ecosystems, and sponsors by converting raw gameplay and viewing data into actionable insights.
As esports matures into a structured digital sport, data services are treated as essential infrastructure rather than optional tools. E-sports data services operate across online competitions, live tournaments, and streaming platforms. Data is generated continuously from games, APIs, broadcasts, and user interactions. Industry observations indicate that more than 75% of professional esports teams now rely on data driven performance analysis to guide training and strategy.
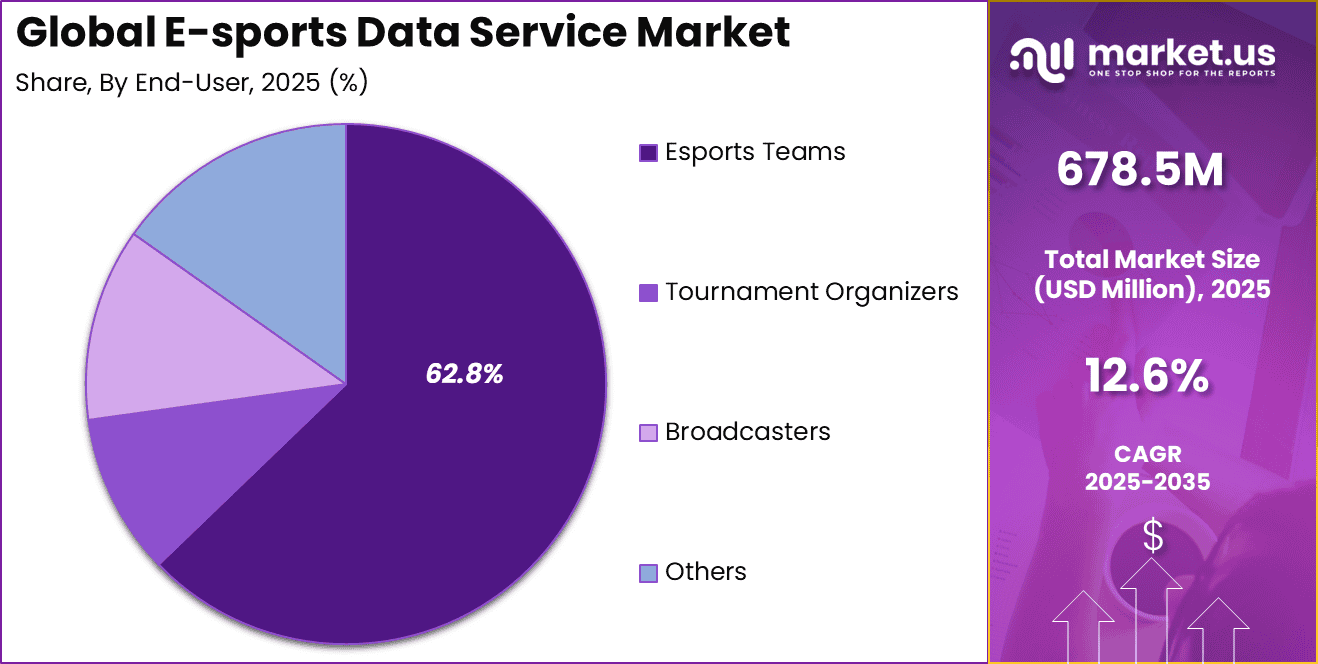
Demand for esports data services is strongest among professional teams, tournament organizers, and content platforms. These stakeholders manage large volumes of performance and engagement data. Internal industry analysis suggests that data guided training programs can improve team win rates by more than 15% over time. This competitive advantage sustains demand at the top tier of esports. By service type, data analytics accounted for 49.7% of adoption. Analytics services transform raw match and audience data into structured insights. These insights are used to evaluate performance trends, strategy effectiveness, and competitive gaps. Teams and organizers rely on analytics to gain measurable advantages. Advanced analytics tools support pattern recognition across large datasets. Player movements, reaction timing, and tactical decisions are analyzed in detail. This enables coaching staff to refine training and in game strategies. Over time, analytics driven preparation has become standard practice. Demand has also increased for predictive insights. Analytics services are used to forecast performance outcomes and identify risk factors. This improves planning and resource allocation. As competition intensifies, analytics remains the most valuable service category. For Instance, in January 2026, Mobalytics rolled out new analytics tools for League of Legends Season 2026, including updated item guides and performance trackers. These features help players analyze builds and stats in real-time, boosting their ranks with data-driven tweaks. The platform’s focus on personalized insights keeps it at the forefront of esports analytics growth. By data source, viewership data represented 37.2% of usage. Viewership metrics include audience size, engagement duration, and geographic distribution. This data is critical for monetization and content planning. Broadcasters and organizers use it to optimize schedules and formats. Viewership data also supports sponsor alignment. Brands evaluate audience demographics and engagement quality before partnerships. Accurate data improves campaign effectiveness and return expectations. This has increased reliance on standardized viewership measurement. Real time audience tracking has added further value. Live data allows adjustments during broadcasts. Content pacing and interaction features can be refined instantly. As streaming platforms evolve, viewership data continues to gain importance. For instance, in December 2025, Esports Charts updated its top games list for 2026 viewership trends. Tracking peaks for Mobile Legends and CS2, the reports provide organizers and sponsors with key metrics on live engagement, driving decisions for streaming and marketing strategies. By end user, e-sports teams accounted for 62.8% of demand. Teams use data services to improve competitive performance and player development. Detailed match analysis supports strategic planning. This has become essential in high level tournaments. Data services also assist in talent evaluation. Player consistency, adaptability, and fatigue indicators are monitored over time. Teams use this data to guide roster decisions. Objective metrics reduce reliance on subjective assessment. Operational planning has also benefited. Teams analyze travel schedules, practice loads, and recovery patterns. This improves long term performance sustainability. As professional standards rise, teams remain the primary users of data services. For Instance, in September 2025, GRID acquired Bayes Esports assets after its insolvency, bolstering data feeds for teams in LoL, Valorant, and CS2. As official partner for ESL FACEIT and Riot, GRID now offers teams reliable real-time stats for scouting and in-game tactics, filling a key gap in the market. Betting and media-focused data providers such as Bayes Esports, Abios, and PandaScore specialize in structured feeds for sportsbooks and media platforms. Statscore and Esports Charts focus on audience metrics and engagement tracking. These players benefit from growing esports betting markets and sponsorship valuation needs. Adoption is strong in Europe and North America where data monetization is advanced. Market intelligence and engagement analytics firms such as Newzoo and Blinkfire provide audience insights and brand impact measurement. Gfinity and Esports Insider contribute through content and ecosystem data. Emerging players such as NGame expand regional coverage. Other vendors enhance competition and innovation, supporting steady growth of esports data services globally.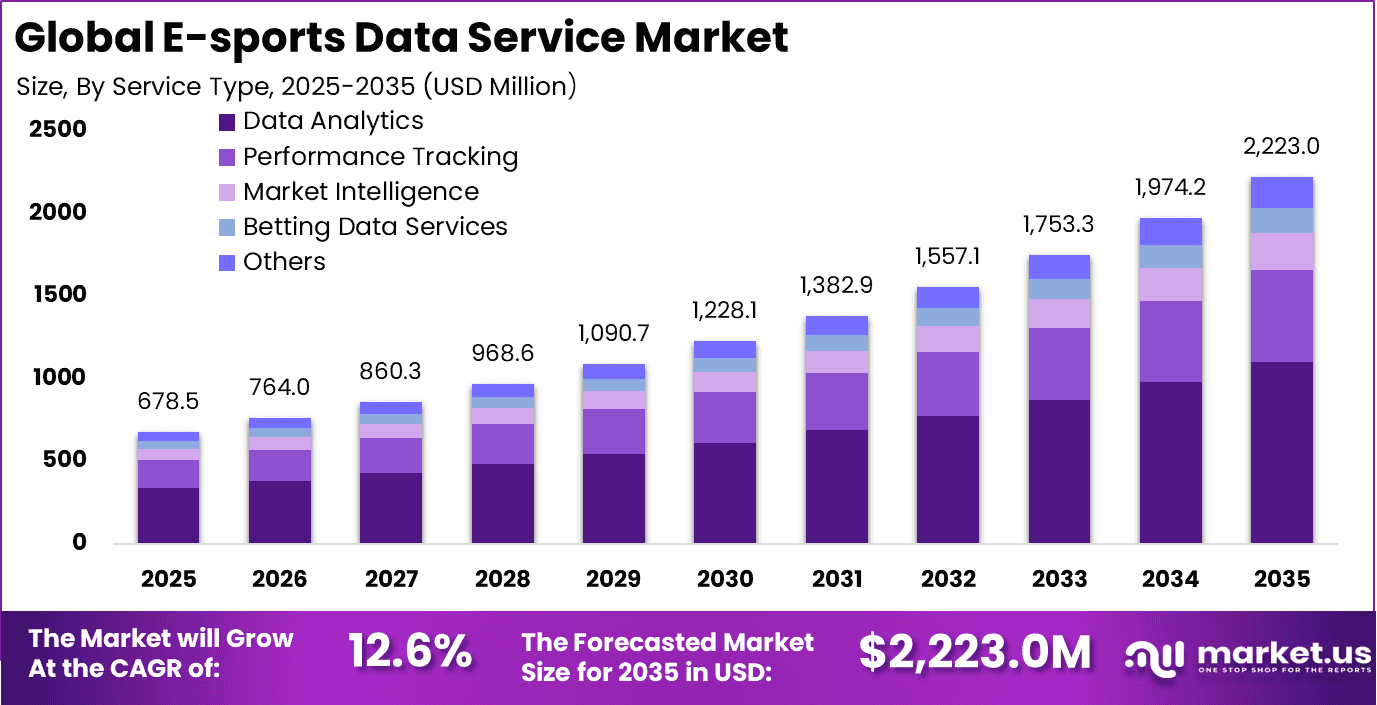
Key Takeaway
Adoption Rates and Market Penetration
Usage Statistics and Engagement
Drivers Impact Analysis
Key Driver Impact on CAGR Forecast (~%) Geographic Relevance Impact Timeline Rapid growth of professional esports leagues and tournaments +3.2% North America, Asia Pacific Short to medium term Increasing demand for real-time match statistics and analytics +2.8% Global Medium term Expansion of esports betting and fantasy gaming platforms +2.4% Europe, North America Medium term Rising media rights and broadcasting partnerships +2.1% North America, Europe Medium term Growing sponsorship and brand engagement analytics needs +1.7% Global Medium to long term Restraint Impact Analysis
Key Restraint Impact on CAGR Forecast (~%) Geographic Relevance Impact Timeline Limited standardization of esports data formats -2.4% Global Medium term Dependency on publisher partnerships for official data access -2.1% Global Short to medium term Data rights and intellectual property constraints -1.9% Europe, North America Medium term Volatility in game popularity and tournament cycles -1.6% Global Medium term Infrastructure gaps in emerging esports markets -1.3% Asia Pacific, Latin America Medium to long term Investor Type Impact Matrix
Investor Type Growth Sensitivity Risk Exposure Geographic Focus Investment Outlook Esports data analytics providers Very High Medium North America, Europe Scalable subscription revenue Media and broadcasting technology firms High Medium Global Data-driven viewer engagement Betting and fantasy gaming platforms High Medium to High Europe, North America Revenue optimization via analytics Private equity firms Medium Medium North America, Europe Consolidation of niche data vendors Venture capital investors High High North America Innovation in real-time data services Technology Enablement Analysis
Technology Enabler Impact on CAGR Forecast (~%) Primary Function Geographic Relevance Adoption Timeline Real-time data capture and API distribution platforms +3.4% Instant match statistics delivery Global Short to medium term AI-driven performance analytics and predictive modeling +2.9% Advanced insights North America, Europe Medium term Cloud-based scalable data infrastructure +2.5% High-volume data processing Global Medium term Automated video tagging and event recognition tools +2.0% Enhanced content analytics Global Medium to long term Data visualization and dashboard platforms +1.8% Commercial and team analysis Global Long term By Service Type Analysis
By Data Source Analysis
By End-User Analysis
Top Key Players in the Market
Recent Developments









